This article covers a case when derived attribute based on another derived attribute results into incorrect metric dimensionality and data.
STEPS TO REPRODUCE
1. This example uses Strategy Tutorial project to demonstrate the problem.
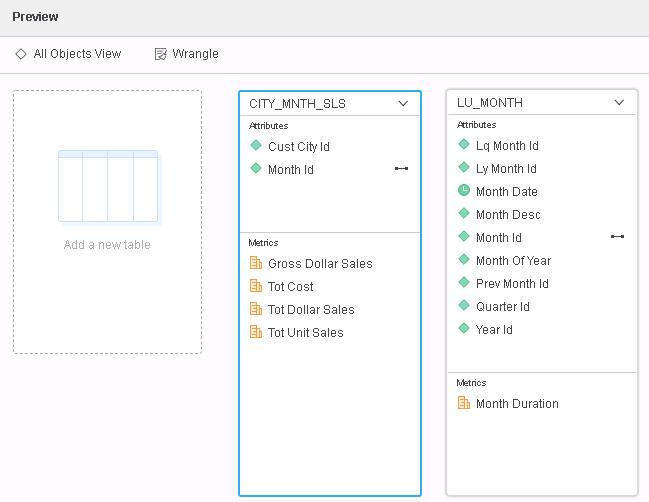
2. In Strategy Web, create a Data Import Cube as following:
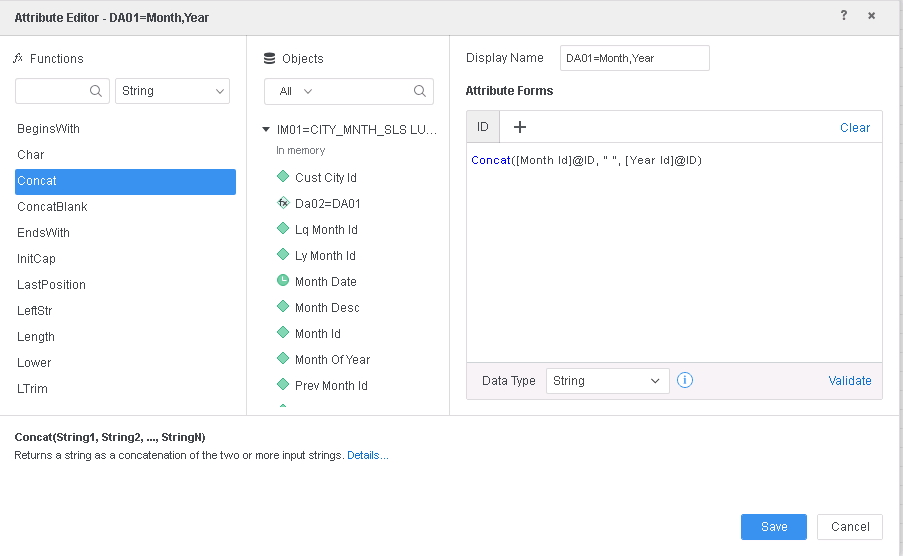
3. Create a derived attribute with following expression:
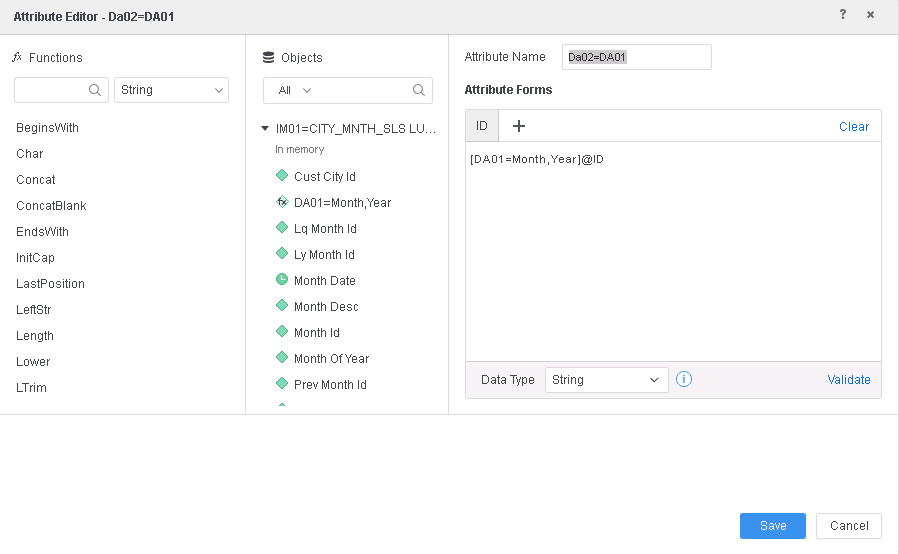
4. Create another derived attribute with following expression:
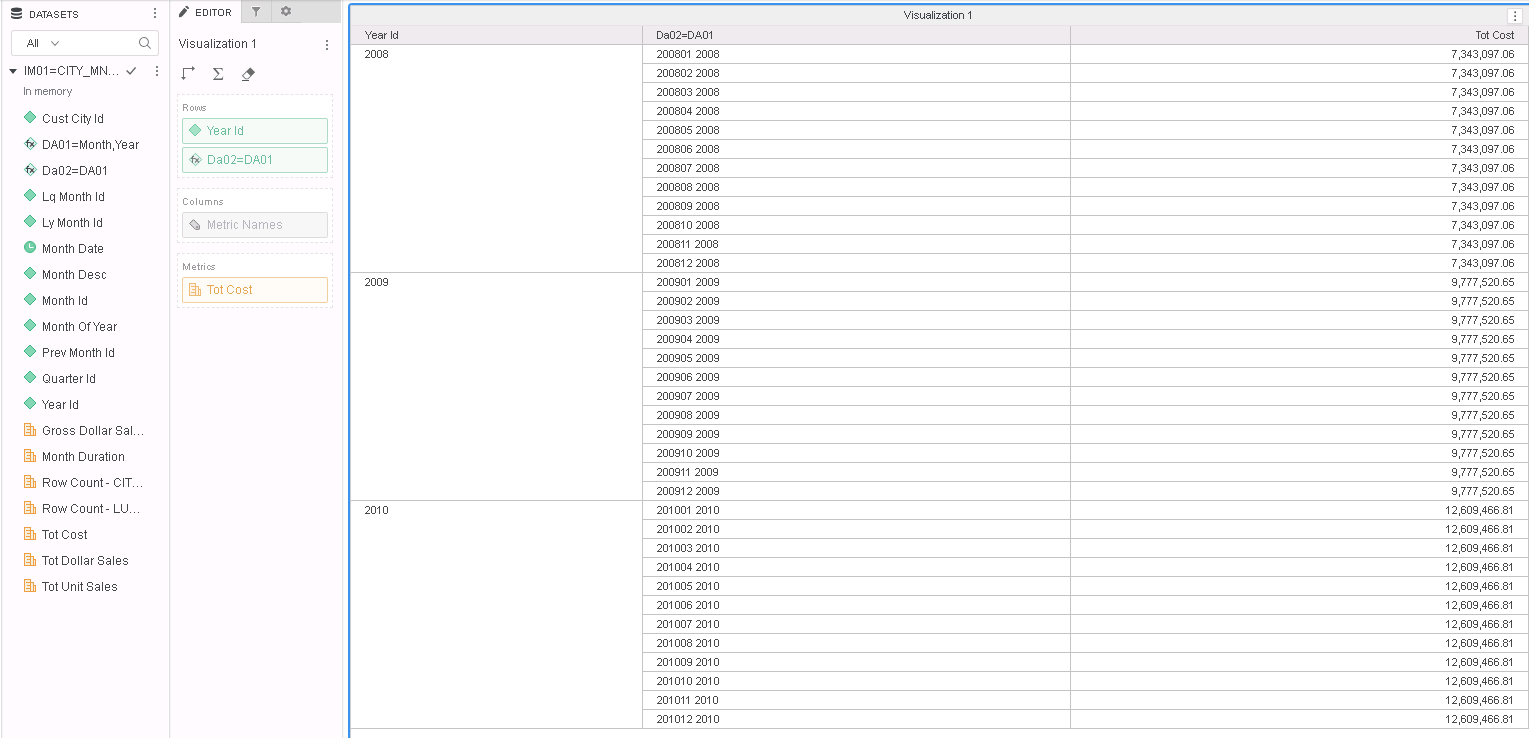
5. Create a visualization as following and note that the "Tot Cost" values are calculated at "Year Id" instead of "Year Id, Da02=DA01" level.
Here is the Query Details of the problematic visualization:
********* Visualization Summary Start **********
Time Spent: 0.016 sec(s)
Query Execution Start Time: 1/22/2019 6:07:11 PM
Query Execution End Time: 1/22/2019 6:07:11 PM
Note: The total 'Time Spent' above may be greater than the summation of the individual step execution times below.
There are preparation tasks for each step that are not individually measured.
********* Visualization Summary End **********
************ Individual Step Start ************
Number of Rows Returned: 36
Time Spent: 0.009 sec(s)
Query Execution Start Time: 1/22/2019 6:07:11 PM
Query Execution End Time: 1/22/2019 6:07:11 PM
Tables Accessed:
Table10 [F_CITY_MNTH_SLS68495C621653A198DA6939812CCC3819]: Month Id, Cust City Id, Row Count - CITY_MNTH_SLS, Tot Cost, Tot Dollar Sales, Tot Unit Sales, Gross Dollar Sales, FACT_TABLE
Table12: Da02=DA01, DA01=Month,Year, RELATIONSHIP_TABLE, ONE_TO_MANY
Table14: Month Id, Year Id, DA01=Month,Year, RELATIONSHIP_TABLE, MANY_TO_MANY
select [Year Id]@[YEAR_ID],
[Da02=DA01]@[ID],
sum([[F_CITY_MNTH_SLS68495C621653A198DA6939812CCC3819].Tot Cost])@{[Year Id]} as [Tot Cost]
from IM01=CITY_MNTH_SLS LU_MONTH, NoRel
with Table Join Tree: [F_CITY_MNTH_SLS68495C621653A198DA6939812CCC3819]
Join (Table14
Join Table12 with output level Tuple([Month Id]@[MONTH_ID], [Year Id]@[YEAR_ID], [Da02=DA01]@[ID])) with output level Tuple([Month Id]@[MONTH_ID], [Year Id]@[YEAR_ID], [Cust City Id]@[CUST_CITY_ID], [Da02=DA01]@[ID])
************ Individual Step End ************
Note that the level of the metric is incorrectly resolved to "Year Id" as specified in red above.
CAUSE
This is a known issue in Strategy 10.11 and below.
ACTION
This issue has been addressed in Strategy 11.0 and above.
If you are upgrading to Strategy 11.0 or above, to pick up the fix, enable project level setting "Data Engine Version" to 11. This property can only be enabled through Workstation. For more details on enabling the setting, refer to Change Data Engine Version.
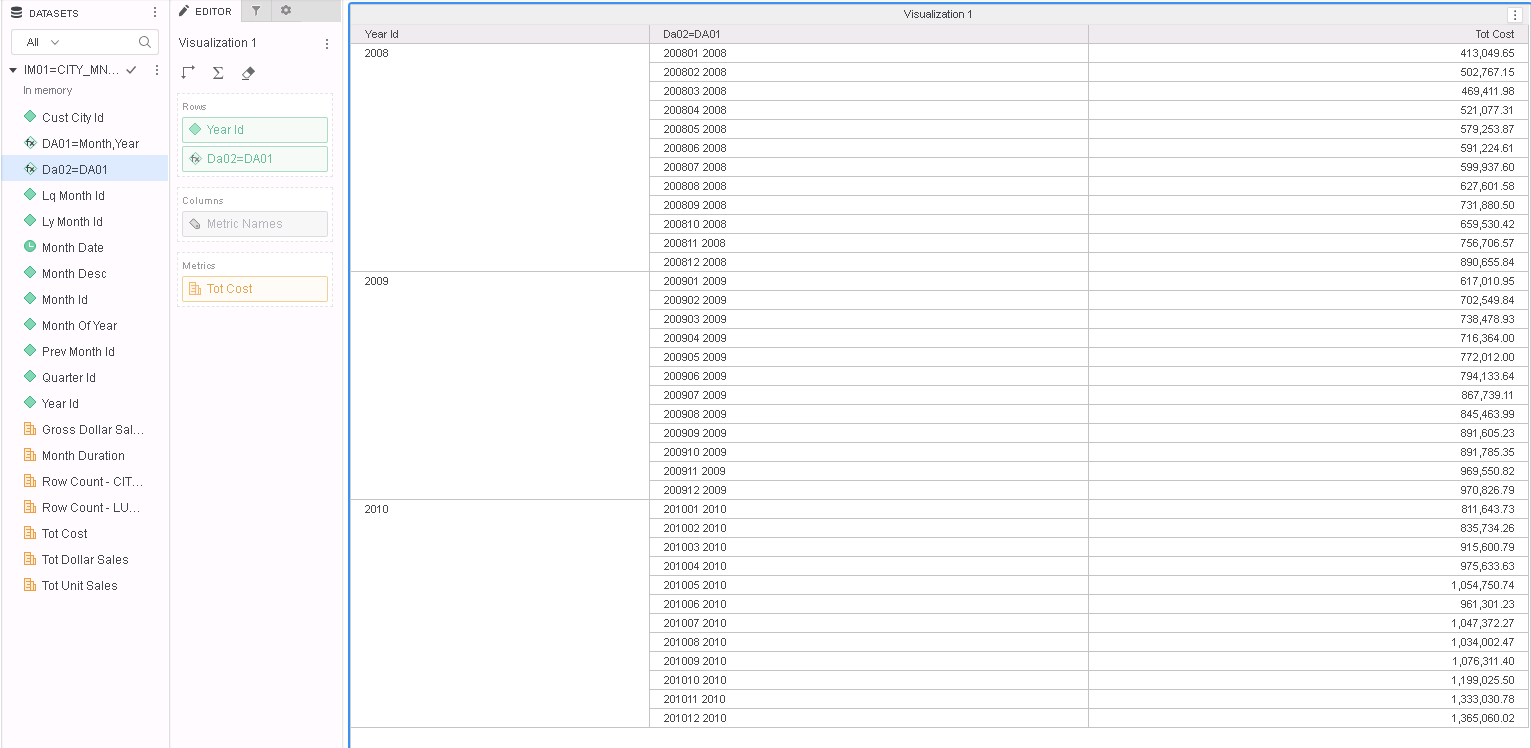
Here is the Query Details of the visualization after the fix:
********* Visualization Summary Start **********
Time Spent: 0.009 sec(s)
Query Execution Start Time: 1/22/2019 5:56:00 PM
Query Execution End Time: 1/22/2019 5:56:00 PM
Note: The total 'Time Spent' above may be greater than the summation of the individual step execution times below.
There are preparation tasks for each step that are not individually measured.
********* Visualization Summary End **********
************ Individual Step Start ************
Number of Rows Returned: 36
Time Spent: 0.002 sec(s)
Query Execution Start Time: 1/22/2019 5:56:00 PM
Query Execution End Time: 1/22/2019 5:56:00 PM
Tables Accessed:
Table10 [F_CITY_MNTH_SLS68495C621653A198DA6939812CCC3819]: Month Id, Cust City Id, Row Count - CITY_MNTH_SLS, Tot Cost, Tot Dollar Sales, Tot Unit Sales, Gross Dollar Sales, FACT_TABLE
Table12: Da02=DA01, DA01=Month,Year, RELATIONSHIP_TABLE, ONE_TO_MANY
Table14: Month Id, Year Id, DA01=Month,Year, RELATIONSHIP_TABLE, MANY_TO_MANY
Alternative CSI:
select [Month Id]@[MONTH_ID],
sum([[F_CITY_MNTH_SLS68495C621653A198DA6939812CCC3819].Tot Cost])@{[Month Id]} as [Tot Cost]
with Table Join Tree: [F_CITY_MNTH_SLS68495C621653A198DA6939812CCC3819]
Save As TempTable10000
select [Da02=DA01]@[ID],
[Year Id]@[YEAR_ID],
sum([Table10000.Tot Cost])@{[Year Id],[Da02=DA01]} as [Tot Cost]
with Table Join Tree: TempTable10000
Join (Table14
Join Table12 with output level Tuple([Month Id]@[MONTH_ID], [Year Id]@[YEAR_ID], [Da02=DA01]@[ID])) with output level Tuple([Month Id]@[MONTH_ID], [Year Id]@[YEAR_ID], [Da02=DA01]@[ID])
************ Individual Step End ************
Note that the level of the metric is correctly resolved to "Year Id, Da02=DA01" as specified in blue above.
The Strategy Internal Reference Number for the issue discussed in this technical note is KB442267 and DE93077.
