Starting with the release of Strategy ONE (March 2024), dossiers are also known as dashboards.
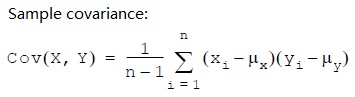
*μ = average value of its subscript
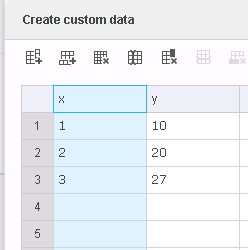
1. Create a new dossier and add new data -> Clipboard
2. Create a derived metric to calculate the covariance between x and y.
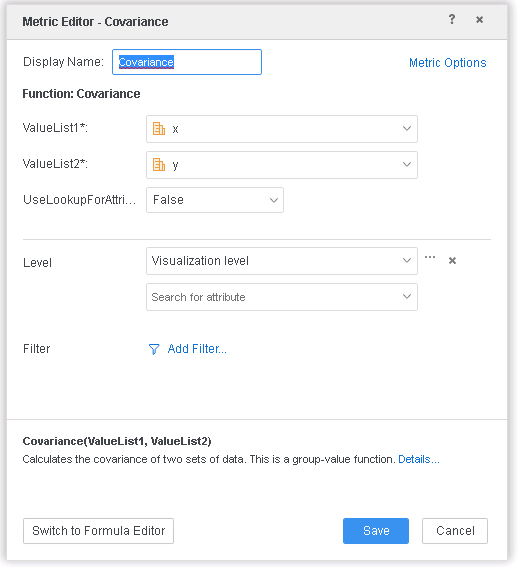
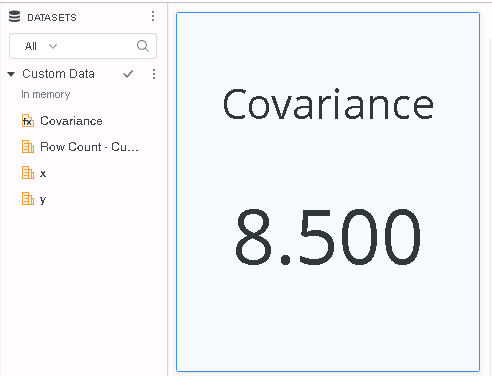
3. Add the Covariance metric created above into a KPI Visualization.
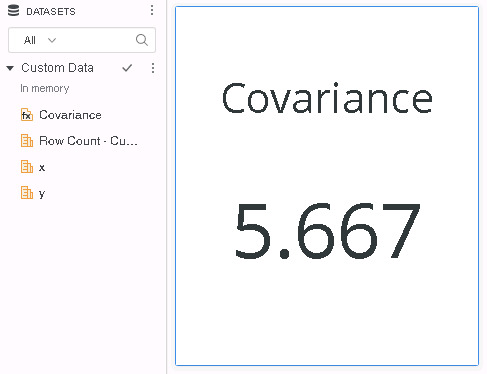
However, based on other data source calculation, the value calculated from the Covariance formula is 5.67.
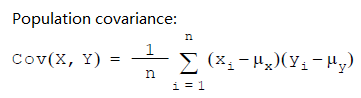
This is caused by the difference between “Population Covariance” and “Sample Covariance” functions.
In Data Engine, covariance is calculated with the Sample Covariance formula while in other data sources, the covariance formula is Population Covariance.
The only difference in formula for Population Covariance and Sample Covariance lies in the fact that Population Covariance is calculated over the entire dataset(N) whereas Sample Covariance is calculated over a sample (N-1), so that the denominator of the Population Covariance is 1 larger than that of the Sample Covariance and will lead to smaller result value.
To resolve this defect, please upgrade to Strategy 2019 or above, and set Data Engine Version setting to 11.
In the new fix, Covariance formula is Population Covariance by default in Data Engine Version 11, and is Sample Covariance by default in Version 10.
Strategy Internal Reference number for this technical note is KB442275 and DE101196.