EducationSoftwareStrategy.com
StrategyCommunity

Knowledge Base

Product

Community

Knowledge Base

TopicsBrowse ArticlesDeveloper Zone

Product

Download SoftwareProduct DocumentationSecurity Hub

Education

Tutorial VideosSolution GalleryEducation courses

Community

GuidelinesGrandmastersEvents
x_social-icon_white.svglinkedin_social-icon_white.svg
Strategy logoCommunity

© Strategy Inc. All Rights Reserved.

LegalTerms of UsePrivacy Policy
  1. Home
  2. Topics
  3. KB442281: Starting 10.4.8 and 10.11, a dashboard with multiple datasets using nested aggregated metric together with element group shows empty results

KB442281: Starting 10.4.8 and 10.11, a dashboard with multiple datasets using nested aggregated metric together with element group shows empty results


Ebenezer Kanamala

Product Specialist • Strategy


Starting 10.4.8 and 10.11, a regression defect is caused by a performance optimization which leads a dashboard with multiple datasets using nested aggregated metric together with element group to show empty results.
Starting with the release of MicroStrategy ONE (March 2024), dossiers are also known as dashboards.

Summary

Starting 10.4.7 and 10.11, a regression defect is caused by a performance optimization which leads a dashboard with multiple datasets using nested aggregated metric together with element group to show empty results.

Steps to Reproduce

1. Create a new dashboard in MicroStrategy Tutorial Project with Web. 
2. Create Dataset #1 with table CITY_CTR_SLS. Note that this cube is not used but created for triggering the defect in multi-cube data blend behavior.
3. Create Dataset #2 with Custom Data and give some random data

Month

Region

M1

M2

Jan

a

6

6

Mar

a

5

2

Feb

b

5

4

Jan

b

4

3


4. In Dataset #2, create metric called M1-M2 using this expression: M1-M2
5. Create metric called Sum(M1-M2) using this expression: Sum(M1-M2)
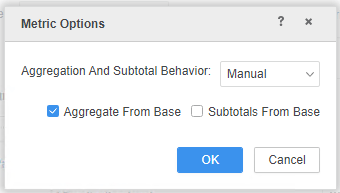
6. Make sure Sum(M1-M2) is Aggregate From Base
ka0PW0000001JaMYAU_0EM2R000000mc4n.jpeg

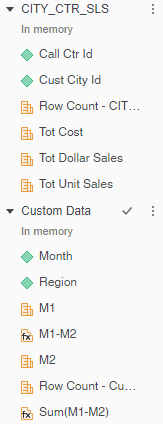
7. The Datasets should look like:

ka0PW0000001JaMYAU_0EM2R000000mc4x.jpeg

8. Add Month Id attribute and Sum(M1-M2) metric to the visualization.
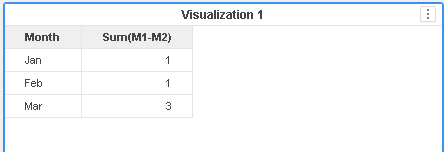
ka0PW0000001JaMYAU_0EM2R000000mc5H.jpeg

9. Group the first 2 elements in Month Id to create a new element group.
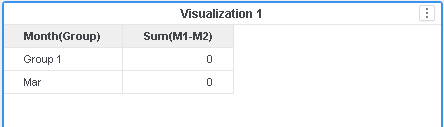
ka0PW0000001JaMYAU_0EM2R000000mc5C.jpeg
The data is wrong and should be 2, 3
 

Cause

This is known issue in between 10.4.8 to 10.11. 
The data was calculated by:
1. Retrieve metrics from Dataset #2 at Month level

select    [Month]@[Month],
    sum(([[F_Custom Data].M1] - [[F_Custom Data].M2]))@{[Month]} as [M1],
    sum(([[F_Custom Data].M1] - [[F_Custom Data].M2]))@{[Month]} as [M2]
from    Custom Data
with Table Join Tree:     [F_Custom Data]
to    Ex1_tempcube0

This represents the result in Ex1_tempcube0:

Month

M1

M2

Jan

1

1

Mar

3

3

Feb

1

1

2. Map the Month(Group) to Month and the metrics on Month level
This represents the result:

Month(Group)

Month

M1

M2

Group 1

Jan

1

1

Mar

Mar

3

3

Group 1

Feb

1

1


3. Aggregate the metric from Month level to Month(Group) level

select [Month(Group)]@[Month],
sum(([M1] - [M2]))@{[Month(Group)]} as [Sum(M1-M2)]
from Ex1_tempcube1

From #1, the definition of M1 is identical as M2, so at #3, when summing up [M1] - [M2], it will always be 0.

This represents the result:

Month(Group)

M1 - M2

M1

M2

Group 1

0

2

2

Mar

0

3

3


Solution

Upgrade to MicroStrategy 2019 or above. We recommend the latest version.
In the new fix, Data Engine fixes its logic and the aggregation calculation is corrected.
Now in MicroStrategy 2019, in step 1, the Engine will retrieve the metric as it is without aggregating it to Month level.select [Month]@[Month],
[Region]@[Region],
[[F_Custom Data].M1] as [M1],
[[F_Custom Data].M2] as [M2]
from Custom Data
with Table Join Tree: [F_Custom Data]
to Ex1_tempcube0

Step 2 and step 3 are the same, but since the metrics are in its original level, when aggregated to Month(Group) level, the data will be correct.
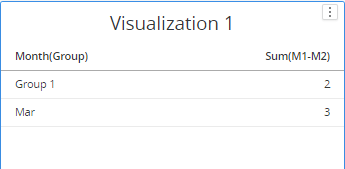
ka0PW0000001JaMYAU_0EM2R000000mc6K.jpeg

Appendix I

The case above is only one symptom that could be caused by this issue. Depends on the aggregation method, in some case, the symptoms can be very misleading. Sometimes the BI designer may design the metric incorrectly, and due to this issue, the data result happens to fit the expectation.

Example:

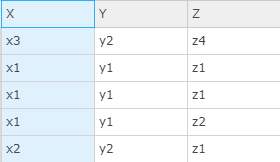
User A created a count metric Count(X)@{Y , Z}, Y and Z being 2 attributes that the count metrics should aggregate to.
Dataset looks like:

ka0PW0000001JaMYAU_0EM2R000000mcuA.jpeg

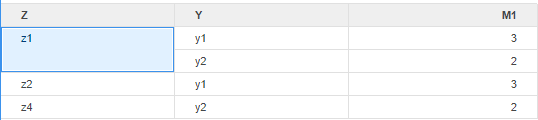
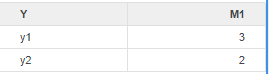
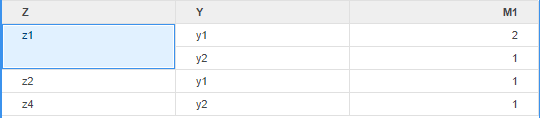
Without the fix, the Engine firstly calculates Count(X)@{Y} as M1, and then map the relationships between Y and Z, creating a table of {M1, Y , Z}, and lastly do another aggregation, effectively calculates Count(M1)@Z. 
Since the count is non-distinct, the double counting result is actually the row count of the joined dataset {M1, Y , Z}.
#1
ka0PW0000001JaMYAU_0EM2R000000mctq.jpeg

#2

ka0PW0000001JaMYAU_0EM2R000000mcvI.jpeg

With the fix, the Engine firstly calculates M1 at (Y, Z) levels in the same time, and the result may differ.
ka0PW0000001JaMYAU_0EM2R000000mcue.jpeg
User may need to redesign their metric based on their needs if data in MicroStrategy 2019 is not what is expected.

Appendix II

The above fix in MicroStrategy 2019 has caused a performance degradation.

Steps to Reproduce

  1. Create a Dossier with 2 Datasets with Tutorial Warehouse Tables
    • MNTH_CATEGORY_SLS
    • Any other table from the warehouse; the data from this dataset will not be used, but it will affect the calculation of the dossier
  2. Create a Derived Attribute for [Category Id]@ID
  3. Create a Derived Metric for Sum([Tot Cost]){~+}
  4. Add the Derived Attribute and the Derived Metric to the dossier
  5. View Query Detail and note that the [Month Id]@[MONTH_ID] is unnecessarily retrieved from the cube, and can potentially cause performance degradation.
select [Category Id]@[CATEGORY_ID],
[Month Id]@[MONTH_ID],
[[F_MNTH_CATEGORY_SLSA10C6F5416DDB8092C31840799339936].Tot Cost] as [Tot Cost]
from MNTH_CATEGORY_SLS
with Table Join Tree: [F_MNTH_CATEGORY_SLSA10C6F5416DDB8092C31840799339936]
to Ex1_tempcube0

Solution

  • Upgrade to MicroStrategy 2019 Update 3 or above. We recommend the latest version.
  • Set Data Engine Version setting to 11 or above.
    • The project level setting Data Engine Version can only be enabled through Workstation. For more details on enabling the setting, see Change Data Engine Version 
In the new fix, Data Engine fixes its logic and will no longer retrieve unnecessary attributes.
New Query Detailselect [Category Id]@[CATEGORY_ID],
sum([[F_MNTH_CATEGORY_SLSA10C6F5416DDB8092C31840799339936].Tot Cost])@{[Category Id]} as [Tot Cost]
from MNTH_CATEGORY_SLS
with Table Join Tree: [F_MNTH_CATEGORY_SLSA10C6F5416DDB8092C31840799339936]
to Ex1_tempcube0
MicroStrategy reference numbers for this technical note are KB442281 and DE119354.

Comment

0 comments

Details

Knowledge Article

Published:

March 21, 2024

Last Updated:

March 21, 2024