EducationSoftwareStrategy.com
StrategyCommunity

Knowledge Base

Product

Community

Knowledge Base

TopicsBrowse ArticlesDeveloper Zone

Product

Download SoftwareProduct DocumentationSecurity Hub

Education

Tutorial VideosSolution GalleryEducation courses

Community

GuidelinesGrandmastersEvents
x_social-icon_white.svglinkedin_social-icon_white.svg
Strategy logoCommunity

© Strategy Inc. All Rights Reserved.

LegalTerms of UsePrivacy Policy
  1. Home
  2. Topics

KB44232: When “Use Manual Grid” is set for Y-axis labels under the graph options, scales values do not follow the interval specified after a certain maximum value in the bar values when changing graph preferences in MicroStrategy Developer 9.x


Stefan Zepeda

Salesforce Solutions Architect • Strategy


SYMPTOM:
 
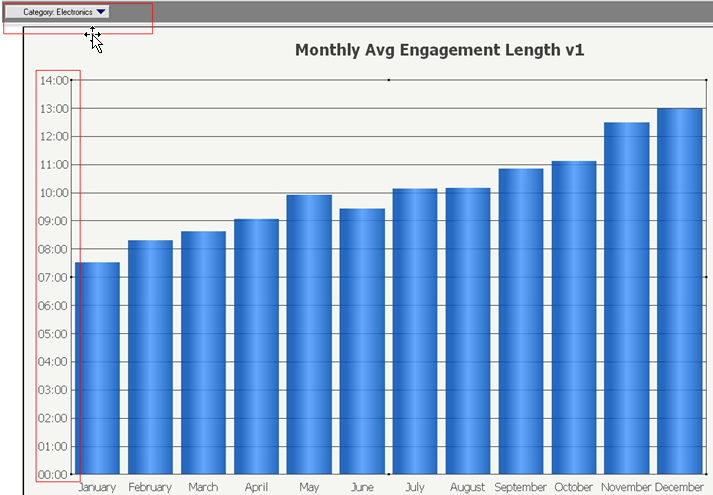
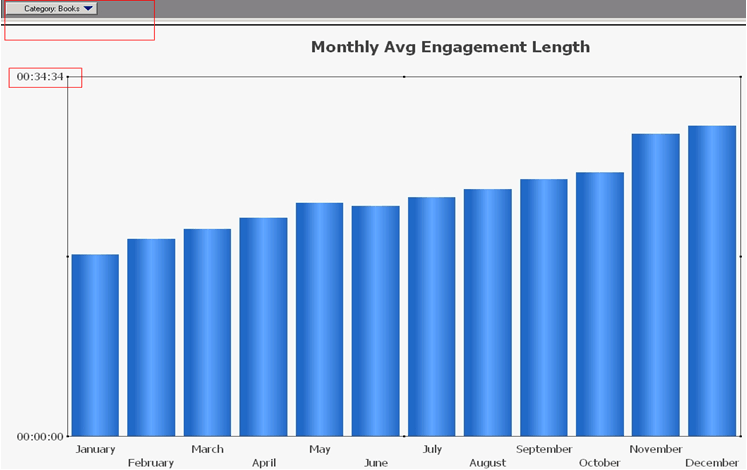
Grid lines for the y-axis no longer respect the set interval for "Use Manual Grid" when bar graph values exceed a certain limit.
 
Steps to Reproduce:

  • In Tutorial project, create a new metric with the formula "(Sum() {~}/10000000)". Save the metric as "Avg Engagement Length"
  • Create a new report. Bring in the "Month of Year" attribute in the rows, "Category" in page by, and the metric from step 1. Save as a graph.
  • Run the report in graph view
  • Under graph options, in the Axes>Y>Grids and Scales select "Use Manual Grid" and input an interval value of 0.000694444444 (Conversion of one day to minutes). Save graph.
  • Run report again, select the page by for category to be electronics. The interval specified in step 4 is respected, as seen below:
ka02R000000kVkAQAU_0EM440000002Cjb.png
  • Change the page by to "Books"
ka02R000000kVkAQAU_0EM440000002Cjd.png
  • Notice that the interval that was specified in step 4 is no longer respected.

CAUSE:
 
The manually specified interval is not respected for the Books category because there is a limit on the number of grid lines on a graph.
 
ACTION:
 
This is working as designed. If there are too many grid lines on a graph, the graph will be too cluttered and labels may overlap.
 
WORKAROUND:
 
Because the intervals cause the maximum lines on the graph to be exceeded, a user can increase the interval so that the grid lines do not exceed the maximum for all categories.


Comment

0 comments

Details

Knowledge Article

Published:

May 25, 2017

Last Updated:

May 25, 2017