SYMPTOM:
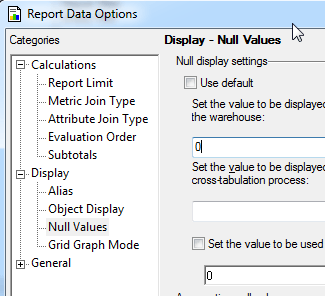
Even though users set the null display to show zero's within Data -> Report Data Options -> Display -> Null Values and this setting gets applied correctly to grids, graphs still show nulls rather than being represented by a zero as the following screenshots show:
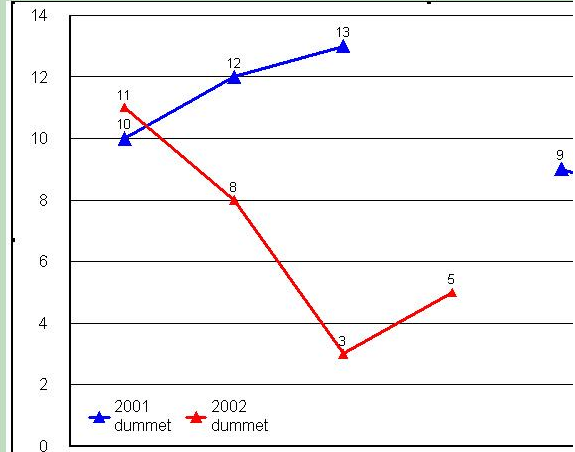
In this graph notice the absence of a blue line betwee the 13 and 9 data points:
CAUSE:
This is because the ability to deal with nulls (display zero instead of null) within a graph is handled through a separate option.
ACTION:
This can be set at either the Report or Project Level.
To set it at the Report level:
To set this at the Project level:
NOTE: If set within the Project Configuration, this value will now be the default behavior for all graph reports in the project.