SUMMARY:
This issue has been classified as a defect by Strategy. The impact is limited a particular type of graph on Strategy Web 9.x. A workarounds is available in the current document. A solution/code fix for this issue is not available in current releases but is being reviewed for a future Strategy release.
SYMPTOM:
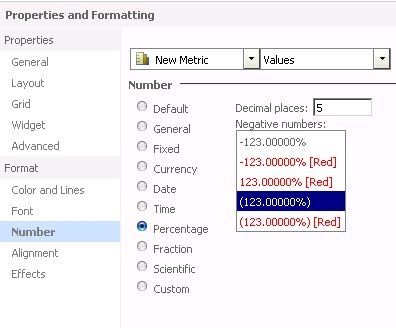
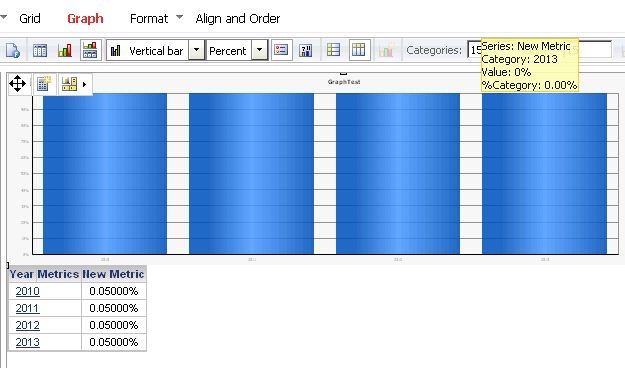
Incorrect value gets displayed in a tooltip of a vertical bar graph in a document when a percentage is selected as a graph type.
STEPS TO REPRODUCE:
CAUSE:
This is a known issue with Strategy Web 9.x.
ACTION:
Contact Strategy Technical Support for an updated status of this issue.
WORKAROUND:
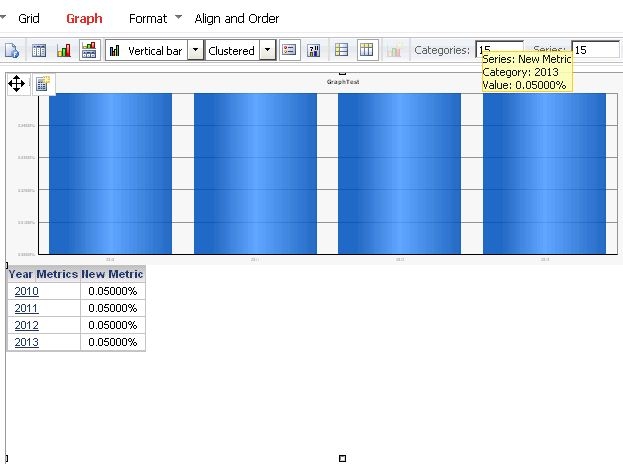
Use different type of graph such as stack bar.
TO LEARN MORE:
Related tech notes:
KB41318: How to modify graph tooltip display for Report Services documents in MicroStrategy Web 9.2.1
KB39423: The metric value for a series is not shown in a tooltip for a graph when displayed as a line graph in 9.0.x and 9.2.x
For graph formatting option on Strategy Web, refer to:
http://www2.microstrategy.com/producthelp/9.3.1/WebUser/WebHelp/Lang_1033/Format_Graph_dialog_Format.htm