To compute the median quarterly sales across each Category in Strategy 9.x, and to support below SQL in Strategy against Vertica 6.X database, steps outlined in below section need to be followed.
Sql
create local temporary table ZZMD01 on commit preserve rows as
select a11.QUARTER_ID AS QUARTER_ID,
a11.CATEGORY_ID AS CATEGORY_ID,
Median(sum(a11.TOT_DOLLAR_SALES)) over ( partition by a11.CATEGORY_ID) AS WJXBFS1
from QTR_CATEGORY_SLS a11
group by a11.QUARTER_ID,
a11.CATEGORY_ID
select pa11.CATEGORY_ID AS CATEGORY_ID,
max(pa11.WJXBFS1) AS WJXBFS1
from ZZMD01 pa11
group by pa11.CATEGORY_ID
Check with database administrator to make sure the warehouse database is supporting the median function. The out of the box Access warehouse data doesn’t support this function.
Follow steps below:
1. Create a metric called ‘MB01’ with formula of
ApplyAgg("Median(sum(#0)) over ( partition by #1 ) ", Revenue, Category@ID) {Category, Quarter}
as shown below:

Note:
2. Create a metric called ‘MB02’ with formula of
Max(){~}|
as shown below:

This metric applies an aggregation function on ‘MB01’ like Max because the ‘Analytic function’ Median will generate a record for each record in the ‘QTR_CATEGORY_SLS’ table and therefore all the records corresponding to the same category but different quarters will have the same median value. As the final report will only contain the category attribute, a ‘Max’ function is required to perform the aggregation and select one of the values from the Quarter and Category combinations.
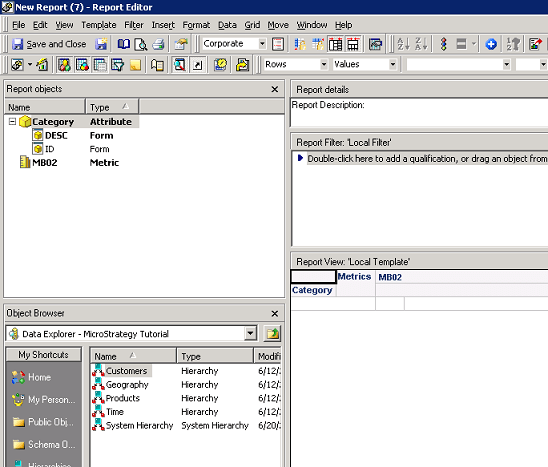
3. Create a report with attribute Category and metric MB02, the SQL can be achieved as shown below: