DESCRIPTION
Color coding of Google Maps widget bubbles has changed in Strategy 9.3.0. Where in pre-9.3.0 versions the threshold color coding of metric fonts has been inherited bubble formatting, it is now required to set the fill color instead.
ACTION:
1. In Editable Mode, right-click the metric used to visualize the bubbles on Google Maps. Choose Thresholds > Advanced and set your desired threshold. Then click the formatting icon or double-click on the formatting preview.

2. Go to color and lines and change the Fill color. Confirm with OK:

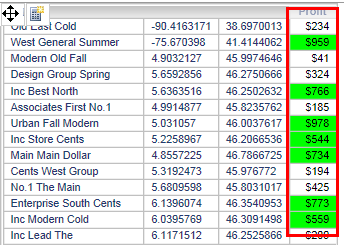
3. The grid should now reflect the newly set threshold:
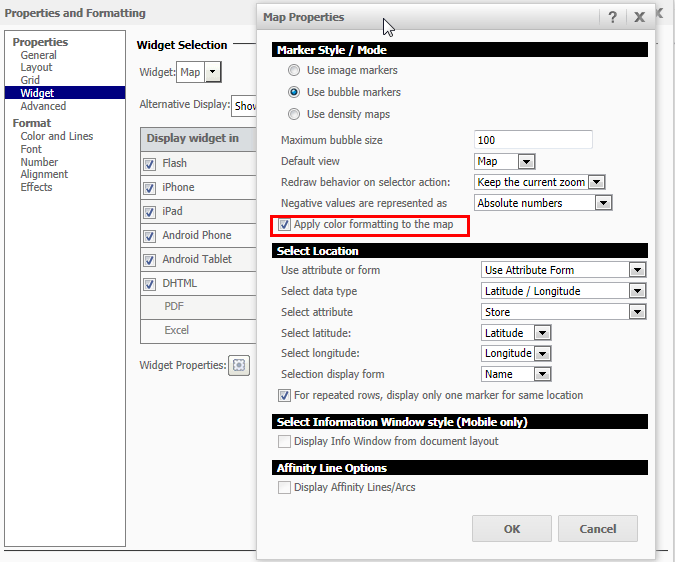
4. Change the grid display to Google Maps with bubble markers and enable the option "Apply color formatting to the map". To do so, go to Properties and Formatting > Widget > DHTML > Map and click the icon next to Widget Properties:
5. Run the document in Interactive mode. As seen on the screenshot, the color of the threshold is applied to the metric bubbles.

