EducationSoftwareStrategy.com
StrategyCommunity

Knowledge Base

Product

Community

Knowledge Base

TopicsBrowse ArticlesDeveloper Zone

Product

Download SoftwareProduct DocumentationSecurity Hub

Education

Tutorial VideosSolution GalleryEducation courses

Community

GuidelinesGrandmastersEvents
x_social-icon_white.svglinkedin_social-icon_white.svg
Strategy logoCommunity

© Strategy Inc. All Rights Reserved.

LegalTerms of UsePrivacy Policy
  1. Home
  2. Topics

KB44521: The data of bar label and bar tooltip will become percentage automatically when the curve label is formatted as percentage in Pareto (percent) graph in MicroStrategy Web 9.3.1


Community Admin

• Strategy


The data of bar label and bar tooltip will become percentage automatically when the curve label is formatted as percentage in Pareto (percent) graph in MicroStrategy Web 9.3.1

SYMPTOM:
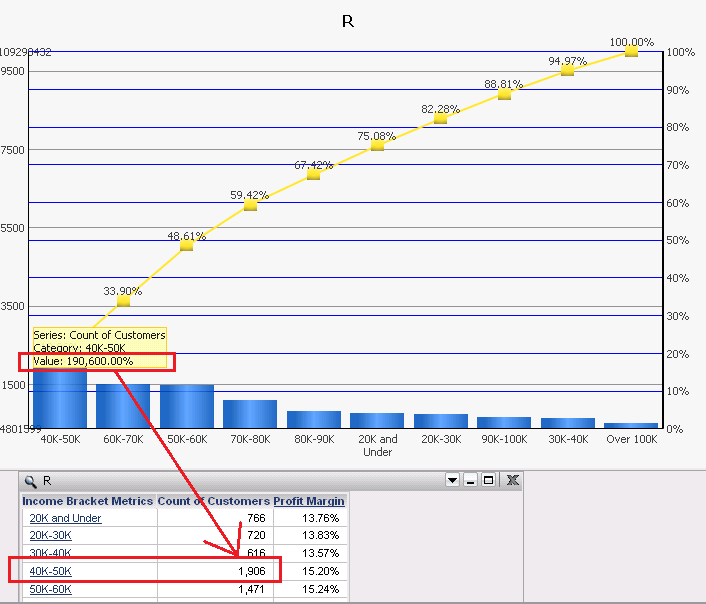
 In Pareto(percent) graph, when the curve label is formatted as percentage, the data of bar label and bar tooltip will become percentage automatically and can not be changed back again.
Below is an example:

ka04W000000OczQQAS_0EM4400000026Y3.png

 
STEPS TO REPRODUCE:

  1. Create a report with Subcategory, Profit and Profit Marin.
  2. Create a document on it and set the grid as "Pareto"& "Percent" graph.
  3. Enable the label of the curve line and change the number format to percentage.
  4. Check the bar's tooltip. The format for Profit becomes percentage as well, which should be dollars. And it can’t be changed again. If the bar label display is enabled, it is also percentage. But in the grid, the data is normal.

 
CAUSE:
 This is a known issue in Strategy.
 
ACTION:
 Please contact Strategy Technical Support for an update on this issue.
 
The Strategy Internal Reference Number for the issue discussed in this technical note is 786333.


Comment

0 comments

Details

Knowledge Article

Published:

June 24, 2017

Last Updated:

June 24, 2017