EducationSoftwareStrategy.com
StrategyCommunity

Knowledge Base

Product

Community

Knowledge Base

TopicsBrowse ArticlesDeveloper Zone

Product

Download SoftwareProduct DocumentationSecurity Hub

Education

Tutorial VideosSolution GalleryEducation courses

Community

GuidelinesGrandmastersEvents
x_social-icon_white.svglinkedin_social-icon_white.svg
Strategy logoCommunity

© Strategy Inc. All Rights Reserved.

LegalTerms of UsePrivacy Policy
  1. Home
  2. Topics

KB44599: The "Matrix of Bar Graphs" visualization and other Flash widgets in Visual Insight are converted to a grid when exported to PDF in MicroStrategy Web 9.4.1.


Community Admin

• Strategy


The "Matrix of Bar Graphs" visualization and other Flash widgets in Visual Insight are converted to a grid when exported to PDF in MicroStrategy Web 9.4.1.

SYMPTOM:
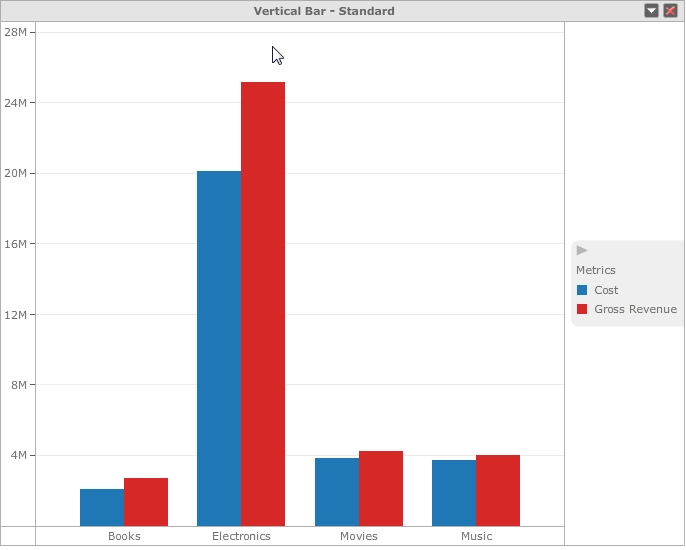
The "Matrix of Bar Graphs" visualization and other Flash widgets in Visual Insight are converted to grids when exported to PDF in Strategy Web 9.4.1.
 
Below, the "Matrix of Bar Graphs" visualization In Visual Insight
ka04W000000OgXlQAK_0EM4400000026Xv.png

 
After exporting to PDF, this visualization appears as a grid:

ka04W000000OgXlQAK_0EM4400000026Y8.png

 
CAUSE:
Flash widgets, such as the "Matrix of Bar Graphs" cannot be displayed in PDF, and are therefore converted to a grid.
 
ACTION:
Change Flash exports from MHT to PDF at the project configuration level as seen in article KB34618: Feature in MicroStrategy Developer 9.x - 10.x: Choose MHT or PDF format to export to Flash.. After the setting is changed, restart the Strategy Web server, then export the dashboard to flash. 
 
MORE INFORMATION:
For a similar issue in Report Services Documents, refer to article TNKB44302: After a dashboard exported to PDF, widgets are replaced by graphs or grids in MicroStrategy Web 9.4.1 and newer version.


Comment

0 comments

Details

Knowledge Article

Published:

June 14, 2017

Last Updated:

June 14, 2017