EducationSoftwareStrategy.com
StrategyCommunity

Knowledge Base

Product

Community

Knowledge Base

TopicsBrowse ArticlesDeveloper Zone

Product

Download SoftwareProduct DocumentationSecurity Hub

Education

Tutorial VideosSolution GalleryEducation courses

Community

GuidelinesGrandmastersEvents
x_social-icon_white.svglinkedin_social-icon_white.svg
Strategy logoCommunity

© Strategy Inc. All Rights Reserved.

LegalTerms of UsePrivacy Policy
  1. Home
  2. Topics

KB44763: A Microchart widget in the Tree mode will display the value of the last element of the child attribute as the group total in MicroStrategy Web 9.x and 10.x


Community Admin

• Strategy


SYMPTOM:
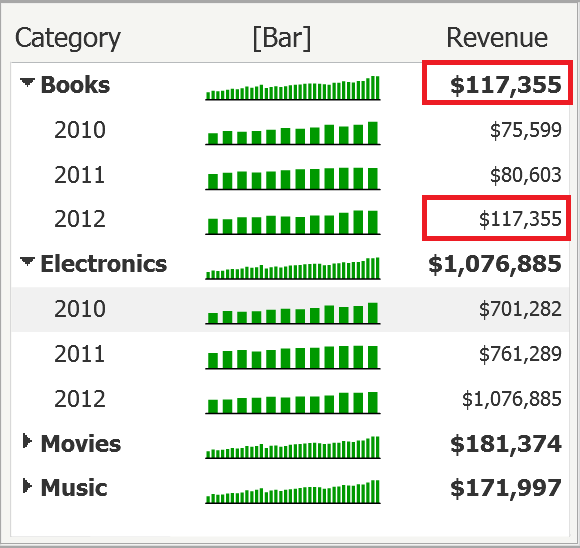
When using a Microchart widget in Tree mode, the Total for the parent attribute is incorrect. Instead, the last value of the child attribute in the group is displayed, in Strategy 9.x.
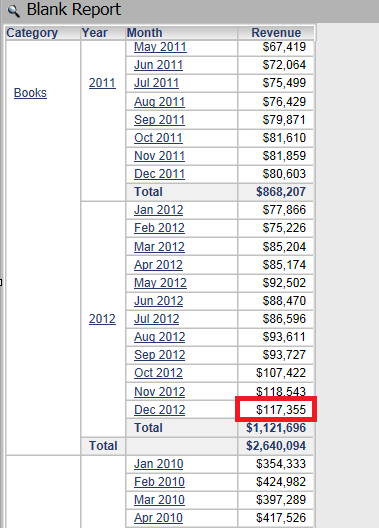
The image below illustrates how the value used as the total for Books is copied from the value for the 2012 - Books.

ka04W000000OfjDQAS_0EM4400000026Vf.png

 
STEPS TO REPRODUCE:

  • Create a new report with the Category, Year and Month attributes and the Revenue metric.
  • Create a new dashboard and add the report as a dataset.
  • Drag the report to the dashboard.
  • In the grid's Properties and Formatting > Widget, select Microchart widget, as shown bellow:
  • Execute the dashboard.
  • Right click on the widget, select Properties.
  • Under Options, select Mode.
  • In the new window, check Tree Display.
  • For the Aggregation Function, select Sum.
ka04W000000OfjDQAS_0EM4400000026VZ.png
  • Disable the Sparkline graph and enable the Bar graph. 
  • Click OK. Notice the issue. 
  • In Editable mode, as seen below,  the value that is displayed as a Total for the Books is the value of the last month in the Books group:
ka04W000000OfjDQAS_0EM4400000026Vb.png

 
CAUSE:
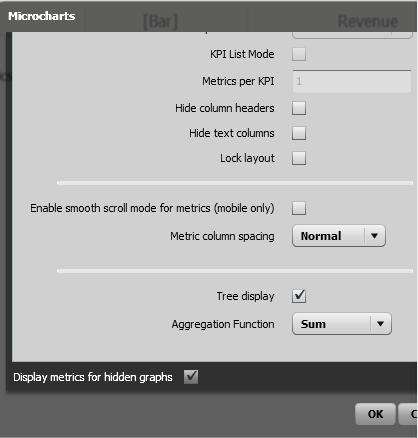
This is expected behavior in Strategy Web 9.x and 10.x. The current implementation of the Microcharts uses the “last” value for all additional metrics displayed adjacent to the sparkline/sparkbar. When the Microchart widget was first introduced, the typical use case for microcharts was to see the last day values for a month or closing values for a day and then see a sparkline showing the ups and downs within that month or day.
ACTION:
This issue was reviewed by our Technology team for feasibility and will not be scoped for a code fix in any upcoming Strategy release.
42985


Comment

0 comments

Details

Knowledge Article

Published:

April 7, 2017

Last Updated:

April 27, 2018