EducationSoftwareStrategy.com
StrategyCommunity

Knowledge Base

Product

Community

Knowledge Base

TopicsBrowse ArticlesDeveloper Zone

Product

Download SoftwareProduct DocumentationSecurity Hub

Education

Tutorial VideosSolution GalleryEducation courses

Community

GuidelinesGrandmastersEvents
x_social-icon_white.svglinkedin_social-icon_white.svg
Strategy logoCommunity

© Strategy Inc. All Rights Reserved.

LegalTerms of UsePrivacy Policy
  1. Home
  2. Topics

KB45039: Explanation of how the standard deviation function of a sample of population, Stdev(), calculates in MicroStrategy and how to define it to output proper results in MicroStrategy


Community Admin

• Strategy


This article describes how the MicroStrategy standard deviation function works.

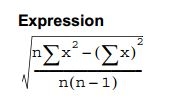
One of the standard deviation functions available in Strategy is the Stdev() function.  This particular function calculates the standard deviation of a sample of a population and uses the following formula in order to calculate a value:
 

ka04W000000OfSFQA0_0EM440000002CcU.jpeg

 
In this formula, n is defined as the number of values in x, and x is the metric for which the standard deviation is calculated against. 
 
We can define x to be the Sum(Fact) {~}, and n be the count of that metric at the level the standard deviation will be calculated at.
 
This expression can be further broken down by the following definition in a smart compound metric:


Sqrt((((Count() {} * Sum(Power(, 2)) {} ) - Power(Sum() {} , 2)) / (Count() {} * (Count() {} - 1))))


Defining a metric to use this compound definition is very SQL intensive, and not very efficient, however, this breakdown of the calculation may assist in understanding how objects need to be defined in order to get the correct results, and how specifically the function is calculating the result.
 
There are usually two challenges when trying to employ a standard deviation metric on a report: getting the correct and expected calculation, and having this metric aggregate at different levels -- the most common is by a Time hierarchy.  In order to overcome these common challenges, think about the following:

  1. What levels should the calculations be performed at?
  2. Once the levels of the calculation are determined, then create a stand-alone metric to perform that calculation (Metric A)
  3. After the stand-alone metric (Metric A) has been created to perform the calculation based on desired levels, then create another metric as the Stdev() metric (Metric B), which will take the standard deviation of the stand-alone metric (Metric A)

In the following example, the desired calculation levels of the stand-alone metric are: number of units sold per Region, per Day.  This example is demonstrated in Strategy Tutorial.
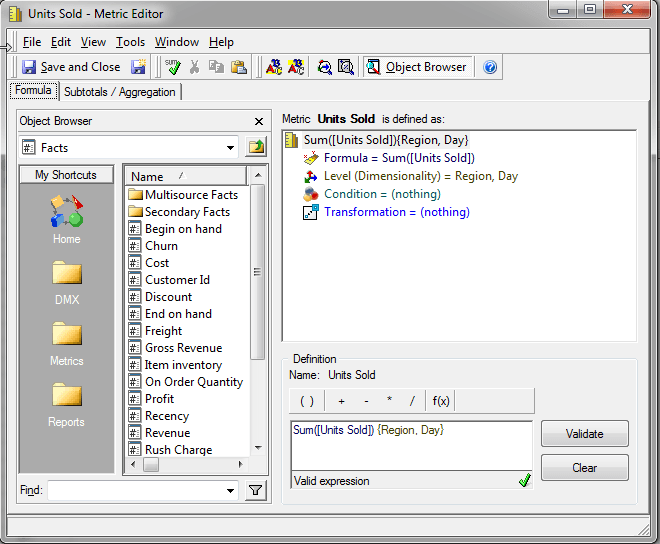
  1. Definitions are created based on the desired calculation levels
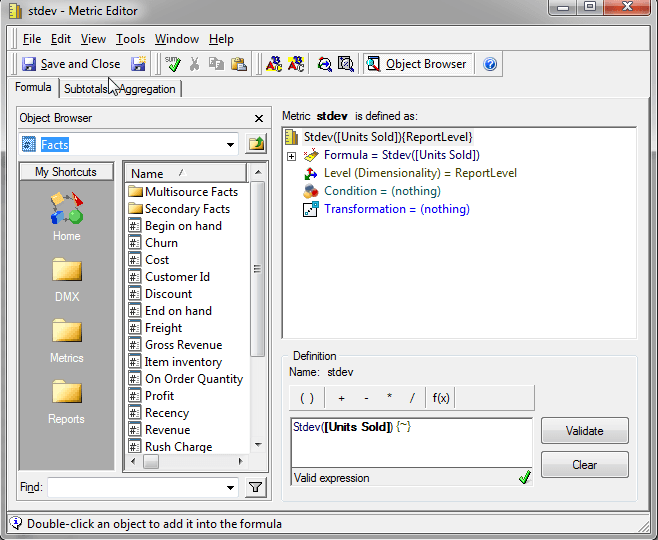
  2. Stdev is calculated off of that, but not explicitly defined at any specific level besides report level
  3. Report results are displayed
ka04W000000OfSFQA0_0EM440000002CcM.png


ka04W000000OfSFQA0_0EM440000002Ccb.png


ka04W000000OfSFQA0_0EM440000002Ccd.png

 
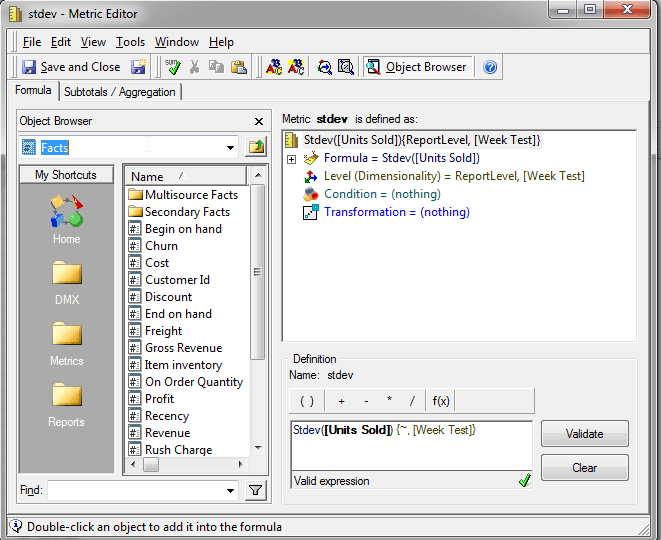
In order to rectify the aggregation nulls, either the Units Sold metric or the Stdev metric needs to have their levels adjusted.  A simple re-definition of the Stdev metric, in this instance, resolves the aggregation nulls issue.  By keeping Units Sold the same -- calculating per Region per Day -- and having Stdev calculate at the level of Week and report level provides the following results:
 

ka04W000000OfSFQA0_0EM440000002Cca.png


ka04W000000OfSFQA0_0EM440000002CcK.png

 
Notice that the standard deviation values are the same for the first seven days and the following seven days in January in 2012.  Enhancing the report display by adding a Week attribute allows the data to make more sense:
 

ka04W000000OfSFQA0_0EM440000002CcO.png

 
Furthermore, removing Day from the grid or from the report completely does not alter the output of the Stdev metric in this instance:
 

ka04W000000OfSFQA0_0EM440000002CcI.png


ka04W000000OfSFQA0_0EM440000002Cck.png


As a result, the desired values are obtained after re-evaluating the levels within the metric definition so that aggregation nulls are not displayed.  If issues are experienced when trying to perform a similar calculation with standard deviation, then the best place to start would be the levels set, and if the calculation with those levels makes sense mathematically so that the Stdev() function is not calculating the standard deviation of itself, which would result in null.
 
Note: More information regarding this standard deviation function and the other standard deviation functions can be found within the Functions Reference Guide.


Comment

0 comments

Details

Knowledge Article

Published:

April 14, 2017

Last Updated:

April 14, 2017