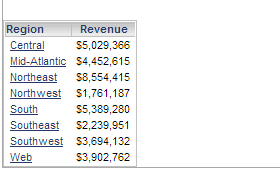
There may be a requirement for a report to display without the grid lines within the cells. This type of custom formatting can be achieved in Strategy Developer and Web 9.x, and is demonstrated here using a report in Strategy Tutorial. This first example is in Developer.
1. Standard report displayed with grid lines enabled by default.
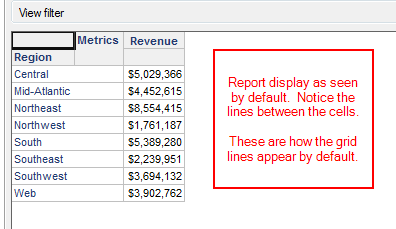
2. Right click the an object header in the rows and select Formatting, Row Axis, Values (or the specific object values if grid lines are to be hidden on an object-by-object basis).
3. In the Format Cells window, select the Borders tab. Within the Borders tab, uncheck the "Use defaults" checkbox, select the No Style under Line Style, and click on the None presets to apply the No Style setting to all cell borders.
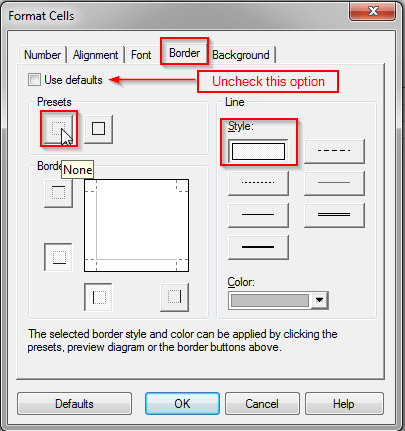
4. Hit OK, and the report display should change to the following:
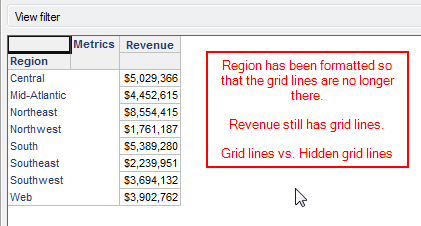
5. Repeat the steps above to format the values for the columns. In this example, the Revenue metric values were formatted to hide its border, and as a result the report displays with no grid lines.
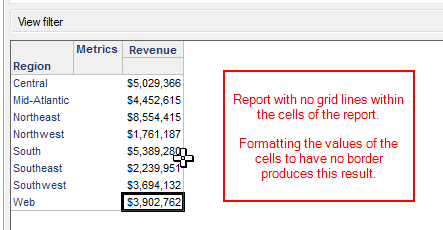
This is how the behavior is set and displayed from within Strategy Developer 9.x. Follow the steps below to make the changes in Strategy Web 9.x.
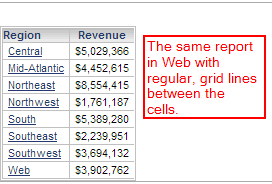
1. The same report accessed in web.
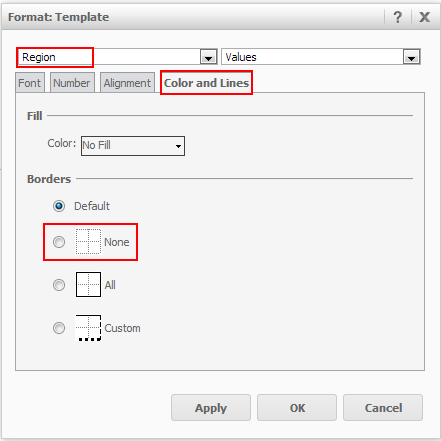
2. Right click the Regions column header and select Advanced Formatting. In the "Format: Template" window click on the "Color and Lines" tab. In the "Color and Lines" tab window, under "Borders", select the "None" option and hit Apply. Before closing the "Format: Template" window, if the desired result is to remove the grid lines in the Revenue column as well, click on the drop-down arrow in the top-left corner and switch the selection to Revenue. Repeat the process and click Apply.
3. The report in Web after the formatting changes have been applied.