When creating a report in Strategy Developer 9.x that will display the top 'n' Item sales (variable) for each Subcategory within a Category , the final report will appear as follows, where the column Custom_Group is the variable that changes as the data in the warehouse is updated.
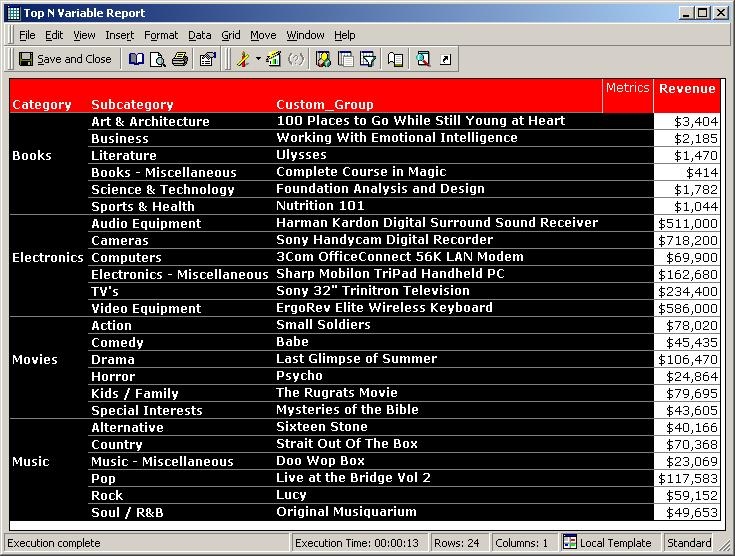
In this case, the example uses Category, Subcategory and Item from the Strategy Tutorial project.
The report shows the Top 1 ranked Items by Revenue for each Subcategory within each Category.
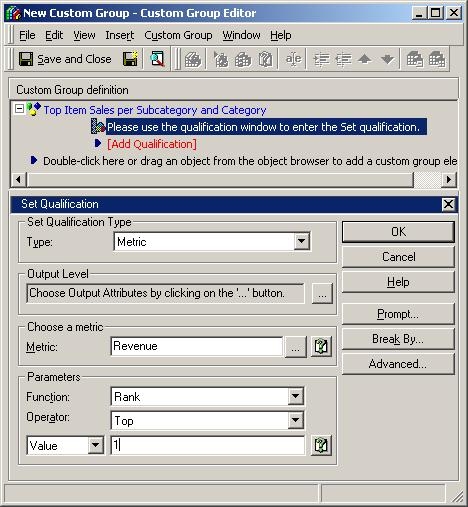
Step 1:
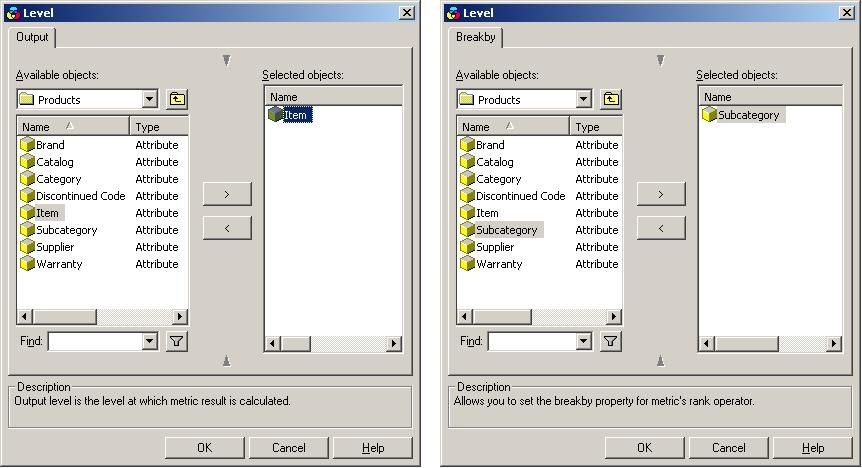
Step 2:
Set the Output and Break by of the Custom Group by executing the following:
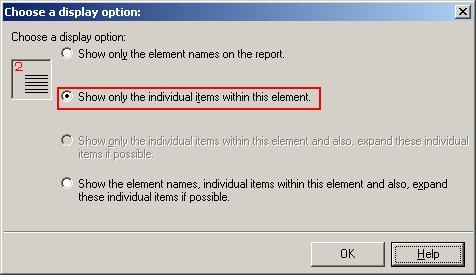
Step 3:
Step 4: