EducationSoftwareStrategy.com
StrategyCommunity

Knowledge Base

Product

Community

Knowledge Base

TopicsBrowse ArticlesDeveloper Zone

Product

Download SoftwareProduct DocumentationSecurity Hub

Education

Tutorial VideosSolution GalleryEducation courses

Community

GuidelinesGrandmastersEvents
x_social-icon_white.svglinkedin_social-icon_white.svg
Strategy logoCommunity

© Strategy Inc. All Rights Reserved.

LegalTerms of UsePrivacy Policy
  1. Home
  2. Topics

KB45324: Prerequisites to use ESRI Maps MicroStrategy Web


Community Admin

• Strategy


Starting with the release of Strategy ONE (March 2024), dossiers are also known as dashboards.

Description

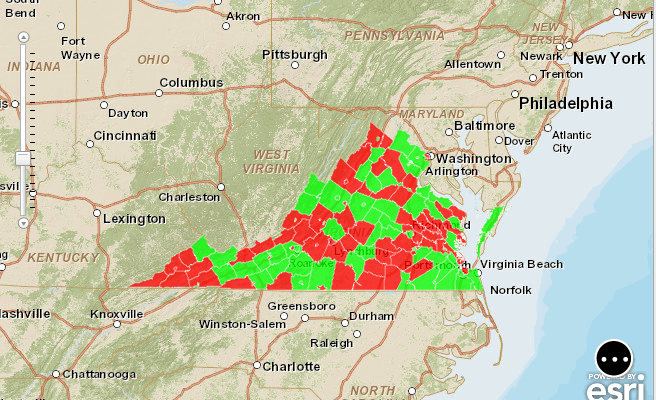
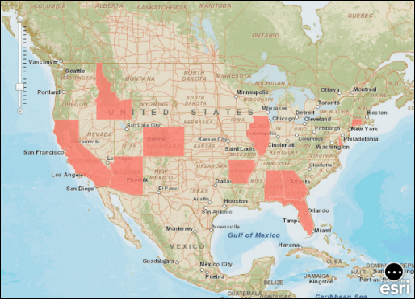
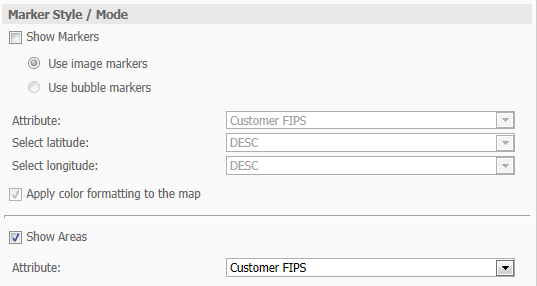
Strategy supports the use of the GIS Connector for ESRI Maps. This connector takes advantage of both widget capabilities for Documents as well as visualizations in Dossiers. This enables users to plot areas or place markers on a specified ESRI base map. An example of an ESRI map displaying the county areas of the state of Virginia with red and green thresholds is shown below:
 

ka0PW0000001JjIYAU_0EM4400000026RM.png

 
This article covers the following concepts:

  1. How to deploy the GIS Connector plugin for ESRI in the Strategy Web application.
  2. Knowing which ESRI Map display mode to use based on your data.
  3. How to modify the esriConfig.xml file to:
    1. Specify a Base Map.
    2. Map geo-attributes when using areas.
  4. Restarting the Strategy Web Server.
  5. How to create a document with the geo-location or geo-attribute information.
  6. How to configure the grid to use the ESRI Map Widget and define the widget properties accordingly.

Deploying the GIS Connector Plugin

  1. During the installation of the Strategy Platform, select the GIS Connectors feature. This will create the ESRI GIS Connector plugin.
  2. Navigate to the home directory of the Strategy Installation such as:

    
    C:\Program Files(x86)\Strategy


  3. Locate and browse into the folder GISConnectors.
  4. Locate and browse into the folder ESRIMap.
    Note: the name of the ESRI folder might be different across Strategy versions.
  5. Inside this folder, locate theESRI Connector for the version of Strategy Web application that applies:
    • J2EE : ConnectorforESRIMap
    • ASP.NET : ConnectorforESRIMap_ASP
  6. Copy this folder to the following location:


\<Web Server Location>\<Strategy Web Home>\plugins 


Identifying the ESRI Map Mode: 


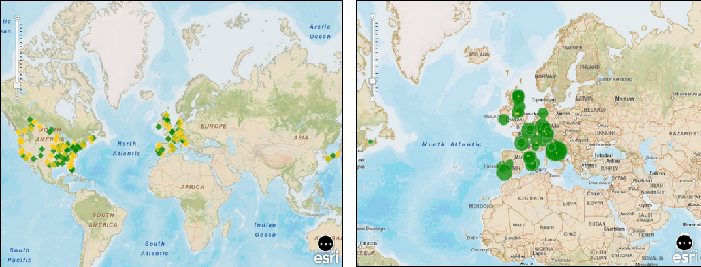
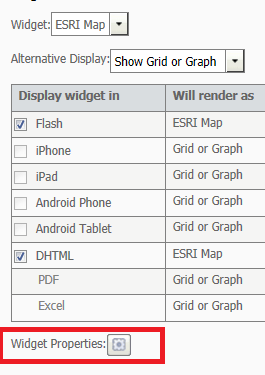
There are two display modes available for ESRI maps:
 

  • Markers: Image markers and bubble markers. This type of map display can be useful for analyses on 
    Note: To use markers, the requirement will be one attribute with two attribute forms, one for latitude and one for longitude.
ka0PW0000001JjIYAU_0EM4400000026RV.png
  • Areas: Colored regions on the map help users analyze data displayed on an ESRI map.
    Note: To use areas, the requirement is to have one attribute with an attribute form that contains information that matches the data from the sample server.
ka0PW0000001JjIYAU_0EM4400000026RT.png


Modifying the ESRICONFIG.XML

If using Markers:

  1. Specify the basemap:

    Base Map tag
    
    <bms>
    <bm key="default">http://services.arcgisonline.com/ArcGIS/rest/services/World_Street_Map/MapServer</bm>
    </bms>


    Additional Base Maps are available in the ESRI ARCGIS Services Directory: http://services.arcgisonline.com/ArcGIS/rest/services
  2. The rest of the XML nodes are not necessary for this functionality.


If using Areas:

  1. Specify the basemap (Refer to the Markers section above).
  2. Map the ID of the Project that will be used in the project tag, as shown below:

    Project
    
    <pjs>
    <pj id="B19DEDCC11D4E0EFC000EB9495D0F44F">


  3. Identify the ESRI Attributes that will be queried (e.g. STATE_NAME).
    The GIS Connector plug-in will query the ESRI Cloud Sample Server for the information of the polygons that will be plotted on top of the base map. The available tables of shapes are available in the ESRI ARCGIS Directory for the Sample Server : http://sampleserver1.arcgisonline.com/ArcGIS/rest/services.
     
    Strategy Tutorial is pre-configured to map the Customer State attribute to the polygon shapes for the States of the United States of America available in the URL : http://sampleserver1.arcgisonline.com/ArcGIS/rest/services/Demographics/ESRI_Census_USA/MapServer/5
    Notice that navigating to this URL will reveal all the fields that administrators can configure to be matched to the Strategy Data. The Customer State attribute will be mapped to the STATE_NAME field in the ESRI Shape layer:

    
    STATE_NAME (Type: esriFieldTypeString, Alias: STATE_NAME, Length: 25 )


  4. Map the ID of the Strategy Attribute that will be mapped to the ESRI Attribute in the attribute tag, as shown below:


    <at id="54BABC8311D59D57C000B28A4CC5F24F">


    The ID shown above is the ID of Customer State in the Strategy Tutorial Project.
  5. Specify the Map Layer that contains the ESRI Field defined in step 3, in the map layer tag:

    
    <ml>http://sampleserver1.arcgisonline.com/ArcGIS/rest/services/Demographics/ESRI_Census_USA/MapServer/5</ml> 


  6. Specify the Field Name that will be queried from the ESRI Map Layer, in the query field tag. This is the field identified in step 3:

    
    <qf></qf>


  7. Specify the ESRI Attribute Name or Alias retrieved from step 3. Notice that the Alias and the Field Name will be the same for the available sample servers.

    
    <ea>state_name</ea>


  8. The final query will look as follows:


    SELECT STATE_NAME

    
    FROM http://sampleserver1.arcgisonline.com/ArcGIS/rest/services/Demographics/ESRI_Census_USA/MapServer/5

    
    WHERE STATE_NAME = CUSTOMER_STATE


After all the changes have been applied, restart the Web Server.
 

Create a Document with the ESRI Map widget

  • Create a report in Strategy with the following requirements.
    • For markers:
      • One attribute with two attribute with latitude and longitude details.
        Latitude and Longitude have to be specified in decimal degrees.
      • One metric.
    • For areas:
      • One attribute with the ID or the DESC with the information that will be compared against the ESRI area information.
      • One metric.
  • Save the report and create a document using this report as a dataset.
  • Insert a grid from the report created in step 1.
  • Within the properties and formatting of the grid, make sure the row and column headers are not set to be merged, like shown below, and select apply.
ka0PW0000001JjIYAU_0EM4400000026RU.png
  • Configure the grid as an ESRI Map widget, like shown below.
ka0PW0000001JjIYAU_0EM4400000026Rg.png
  • Configure the Widget Properties according to the mode to be used:
ka0PW0000001JjIYAU_0EM4400000026Rh.png
  • Run the Document in Presentation mode.


KB45324


Comment

0 comments

Details

Knowledge Article

Published:

April 4, 2017

Last Updated:

March 21, 2024