EducationSoftwareStrategy.com
StrategyCommunity

Knowledge Base

Product

Community

Knowledge Base

TopicsBrowse ArticlesDeveloper Zone

Product

Download SoftwareProduct DocumentationSecurity Hub

Education

Tutorial VideosSolution GalleryEducation courses

Community

GuidelinesGrandmastersEvents
x_social-icon_white.svglinkedin_social-icon_white.svg
Strategy logoCommunity

© Strategy Inc. All Rights Reserved.

LegalTerms of UsePrivacy Policy
  1. Home
  2. Topics

KB45353: How to customize the display of category axis labels in a graph in MicroStrategy Developer?


Community Admin

• Strategy


How to customize the display of category axis labels in a graph in MicroStrategy Developer?

In some business scenarios, it is required to customize the display of category axis labels in a graph in Strategy Developer. For example, it is required to display elements of only two attributes in category axis labels if there is three attributes in rows in the grid.
The following steps demonstrate how to do that in Strategy Tutorial project:
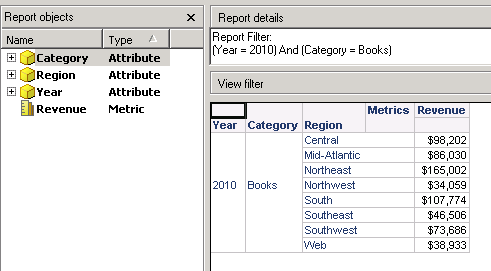
  1.  Create a report with Year, Category and Region in rows, Revenue in columns and some report filters as shown below:
ka04W000000OfOcQAK_0EM440000002Ca5.png


  • Elements of three attributes will display in category axis labels in the bar graph by default as shown below:
ka04W000000OfOcQAK_0EM440000002Ca8.png


  1. In grid view, right click on attribute Region and make it display only ID form with number values as shown below:
ka04W000000OfOcQAK_0EM440000002Ca3.png


  1. Edit formatting of region values and set custom formatting as blank space as shown below:
ka04W000000OfOcQAK_0EM440000002CZz.png


  • The grid will display blank values for each region as shown below:
ka04W000000OfOcQAK_0EM440000002CaQ.png


  1. Switch to graph. The region elements will disappear in category axis labels as shown below:
ka04W000000OfOcQAK_0EM440000002Ca1.png


Comment

0 comments

Details

Knowledge Article

Published:

May 31, 2017

Last Updated:

May 31, 2017