This Technical Note explains how to increase the number of categories displayed in a bar graph visualization in Visual Insight. The maximum number of categories displayed by default is 30.
1. Create a bar graph visualization for a report that has above 30 categories. In the example below, the report contains 50 category elements, whereas only the first 30 are displayed on the visualization:
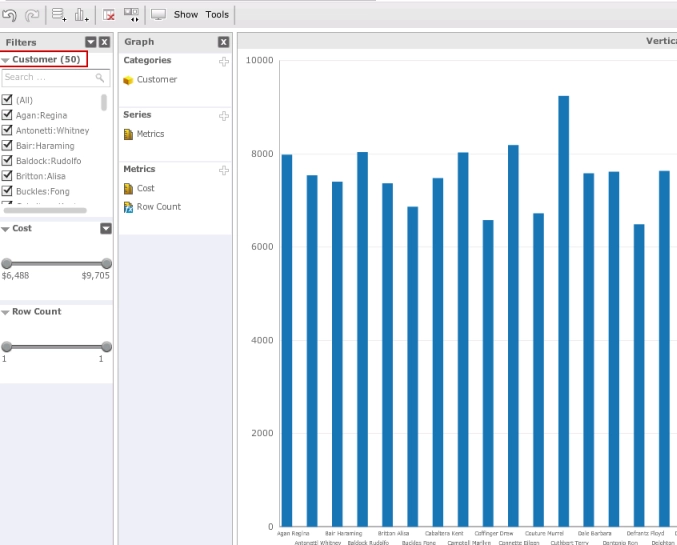
2. Hover the cursor over the Graph panel, then click the arrow icon in the top right and select the Show Properties option.
3. From under the Properties Panel, increase the Max categories value:

