In Strategy 9.3.x and prior releases grids (or graphs) on a Report Services Document could only use template units from a single dataset. if a view filter is applied on the grid or graph, the Analytical Engine applies the filter directly to the dataset used for the grid.
With the release of Strategy Analytics Enterprise 9.4.x and newer releases, users can choose template units (attributes, metrics) from any dataset in the document in a single grid. When a view filter is defined for the grid (or graph) in the document, the view filter will be applied when the data subsetting operation is carried out, and after the data from multiple datasets are joined together the view filter is applied again.
If the attribute used in the view filter is not present in the grid, the Analytical Engine uses the following rules to decide which attribute to apply the filtering criteria on:
1. When the attribute to be filtered is in the grid, then directly apply the filtering criteria to the attribute.
2. If there are no attributes in the datasets related to the view filter attribute then the filtering criteria is ignored. The relationships considered by the Engine are through the Project schema - parent, child and sibling relationships.
3. If an attribute on the dataset to be used is related to the filtering attribute then:
Users may consider the following examples:
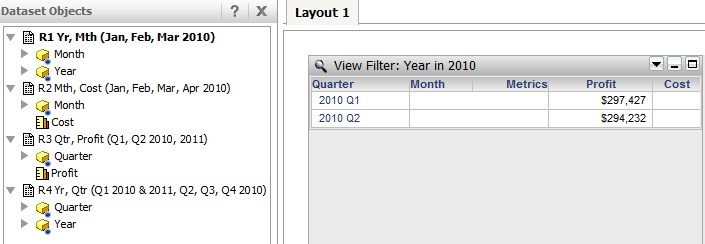
a. In the example below, the View filter for the grid is 'Year = 2010'. Here you see that the Analytical Engine chooses the dataset R2 for the grid so that the view filter can be applied to the 'Quarter' attribute as this is the closest child attribute in relation to 'Year'. The view filter is not applied to Month because Quarter is a direct child of Year and is related more closely than Month.
b. In the example below, a new dataset is added containing the unrelated attribute 'Category' which is used as a view filter and is therefore ignored. The grid source for the grid is R3:

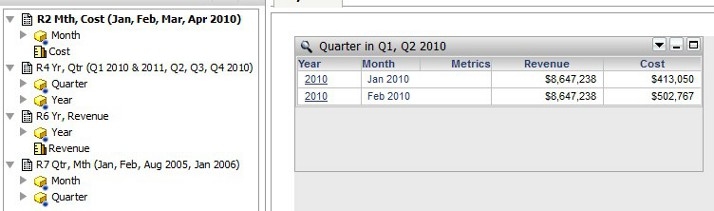
c. In the example below, even though a {Year, Quarter} relationship exists, the Engine will use the {Quarter, Month} relationship to apply the view filter on 'Month' and display the data accordingly: