EducationSoftwareStrategy.com
StrategyCommunity

Knowledge Base

Product

Community

Knowledge Base

TopicsBrowse ArticlesDeveloper Zone

Product

Download SoftwareProduct DocumentationSecurity Hub

Education

Tutorial VideosSolution GalleryEducation courses

Community

GuidelinesGrandmastersEvents
x_social-icon_white.svglinkedin_social-icon_white.svg
Strategy logoCommunity

© Strategy Inc. All Rights Reserved.

LegalTerms of UsePrivacy Policy
  1. Home
  2. Topics

KB45555: In MicroStrategy Analytics Enterprise, how is data from multiple datasets combined for grids which do not have any metrics?


Stefan Zepeda

Salesforce Solutions Architect • Strategy


This article describes how data blending works when no metrics are present

Introduction
Starting with Strategy Analytics Enterprise, report services documents can contain grids with objects coming from more than one dataset. This feature is documented in the following Strategy Knowledge Base document: 
KB44944: Multiple datasets in a single grid/graph/widget object in Strategy Web
 
Users can set the source of the grid to a particular dataset or choose no dataset (in which case, the Strategy engine will determine the best suited dataset). In the case, where the source of the grid is set to none and when there are metrics on the grids, the Strategy Analytical engine chooses the dataset which best gets the values for the metrics involved.
Information provided in this document will help users understand how the Strategy Analytical engine will display data for the grid in cases where the source of the grid is set to none and when there are no metrics on the grid.
 
Note: Examples used in this document are based on the Strategy Tutorial project.
 
Case1: Datasets with different attributes, but from the same hierarchy
Example 1

  • Consider dataset DS0 with attributes 'Year', 'Quarter' and metric 'Cost'. Add a filter for 'Quarter in (2010 Q1, 2010 Q2)'. The data in  the executed report is as shown below.
ka02R000000kcMVQAY_0EM440000002CYt.jpeg
  • Consider dataset DS1 with attributes 'Quarter', 'Month' and metric 'Profit'. Add a filter for 'Month in (Jul 2010, August 2010)'. The data in the executed report is as shown below.
ka02R000000kcMVQAY_0EM440000002CYw.jpeg
  • Add datasets DS0 and DS1 to a document and add a grid to the document with the attributes 'Year', 'Quarter' and 'Month'. Set the datasource of this grid to 'None'
  • Upon execution of the document, the data on the grid is as shown below
ka02R000000kcMVQAY_0EM440000002CYi.jpeg

As seen in the above screenshot, ALL the attribute elements are seen for ALL the attributes. The Strategy analytical engine retains the data relationship between attributes within the same dataset and pads the empty cells with NULLs when joining attributes from all the datasets. Even though the 'Year' and Quarter' attributes are related, there is no data relationship establishing that element '2010 Q3' belongs to the year '2010', therefore a NULL is seen for the year corresponding to quarter '2010 Q3'. If a 3rd dataset with attributes 'Year' and 'Quarter' is added to the document (filtering on Year in 2010), data relationship gets established between the year '2010' and quarter '2010 Q3'. In this case, the year 2010 gets associated to the 'Month' attribute also as shown below.
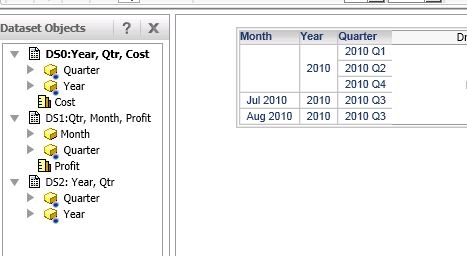
ka02R000000kcMVQAY_0EM440000002CYg.jpeg

 
Example 2
The following example also demonstrates the same concept explained above. A view filter has been added to show how  NULLS are inserted as required.

  • Consider dataset DS0 with attribute 'Month' and metric 'Profit'.  Add a filter for 'Month in (Jan 2010)'
  • Consider dataset DS1 with attributes 'Month' and 'Quarter'. Add a filter for 'Month in (Feb 2010)'
  • Consider dataset DS2 with attribute 'Quarter' and metric 'Revenue'. Add a filter for 'Quarter in (2010 Q1)'
  • Create a document with the above 3 datasets and add a grid to the document with attributes 'Quarter' and 'Month'. Set the datasource of this grid to 'None'. The data is as shown below.
ka02R000000kcMVQAY_0EM440000002CYm.jpeg
  • Add a view filter to the grid : 'Month in Jan 2010'. In this case,  the data is as shown below.
ka02R000000kcMVQAY_0EM440000002CYy.jpeg

 
Case2: Datasets with different attributes, NOT from the same hierarchy  

  • Consider dataset DS0 with attributes 'Year', 'Quarter' and metric 'Cost'. Add a filter for 'Quarter in (2010 Q1, 2011 Q1)'
  • Consider dataset DS1 with attributes 'Region' and metric 'Profit'.
  • Add datasets DS0 and DS1 to a document and add a grid to the document with the attributes 'Year' and 'Region'. The datasource of the grid can be set to anything.
  • Upon execution of the document, the data on the grid is as shown below. Since the attributes are unrelated, a cross-join is done between the attributes.
ka02R000000kcMVQAY_0EM440000002CYu.jpeg


Comment

0 comments

Details

Knowledge Article

Published:

May 5, 2017

Last Updated:

May 5, 2017