EducationSoftwareStrategy.com
StrategyCommunity

Knowledge Base

Product

Community

Knowledge Base

TopicsBrowse ArticlesDeveloper Zone

Product

Download SoftwareProduct DocumentationSecurity Hub

Education

Tutorial VideosSolution GalleryEducation courses

Community

GuidelinesGrandmastersEvents
x_social-icon_white.svglinkedin_social-icon_white.svg
Strategy logoCommunity

© Strategy Inc. All Rights Reserved.

LegalTerms of UsePrivacy Policy
  1. Home
  2. Topics

KB45618: The Grid Interval values manually set for a Bubble graph are lost after exporting to Excel in MicroStrategy Web 9.x.


Community Admin

• Strategy


The Grid Interval values manually set for a Bubble graph are lost after exporting to Excel in MicroStrategy Web 9.x.

SYMPTOM:
 
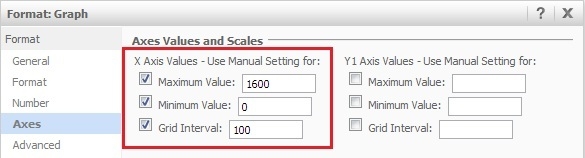
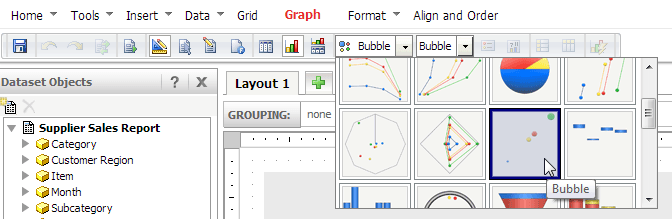
A user creates a bubble chart and sets a custom x-axis maximum, minimum, and a Grid Interval value of 100, like shown below:

ka04W000000OdlLQAS_0EM4400000026Oz.jpeg

 
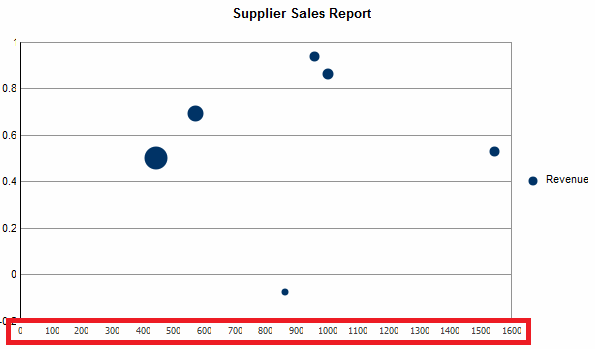
These values are applied correctly when viewing the graph in Strategy Web 9.x, like shown below:
 

ka04W000000OdlLQAS_0EM4400000026Og.png

 
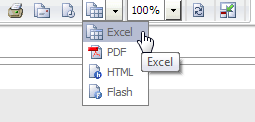
However, the Grid Interval value is lost when the user exports the document to Excel, like shown below.

ka04W000000OdlLQAS_0EM4400000026Oe.png

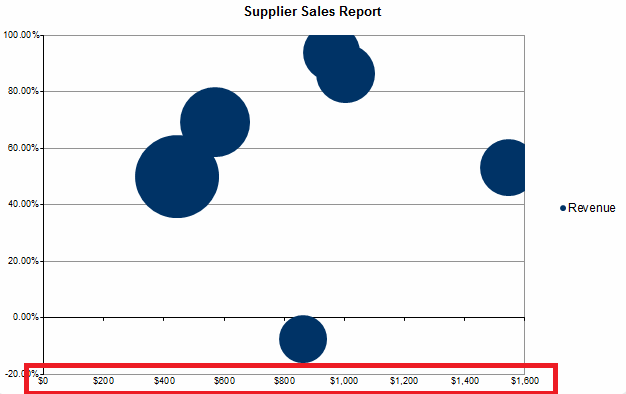
Notice the Grid Interval is of 200.
 
STEPS TO REPRODUCE:
 
Follow these steps to reproduce this issue in Strategy Tutorial.

  • Create a new document.
  • Add a dataset to the document.
  • Insert the dataset as a grid into the document.
  • Change the View Mode to "Graph View", like shown below.
     
ka04W000000OdlLQAS_0EM4400000026P0.png
  • In the toolbar, change the graph style to "Bubble", like shown below.
     
ka04W000000OdlLQAS_0EM4400000026Of.png
  • Switch to Editable view mode.
  • Right-click within the graph, and click "Format" > "Axes".
  • Change the X Axis Maximum, Minimum, and Grid Interval values, as shown above.
  • Click OK. Notice that the x-axis is now formatted as desired, with the correct intervals.
  • Export the document to Excel, like shown below.
     
ka04W000000OdlLQAS_0EM4400000026Oy.png
  • Open the exported document. Notice that the Grid Interval scale is no longer the way it was configured.

CAUSE:
 
This is a known issue in Strategy Web 9.x.
 
ACTION:
 
Contact Strategy Technical Support for an update on this issue.
 
WORKAROUND:
 
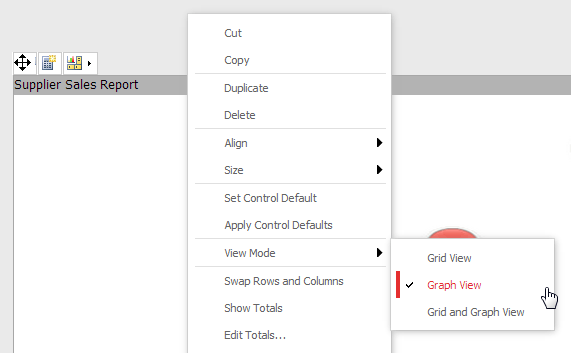
In Design view mode, go to "Tools" > "Document Properties" > "Export" and select the "Embed images" and "Use embedded bitmaps" options, as shown below.

ka04W000000OdlLQAS_0EM4400000026Oh.png

 
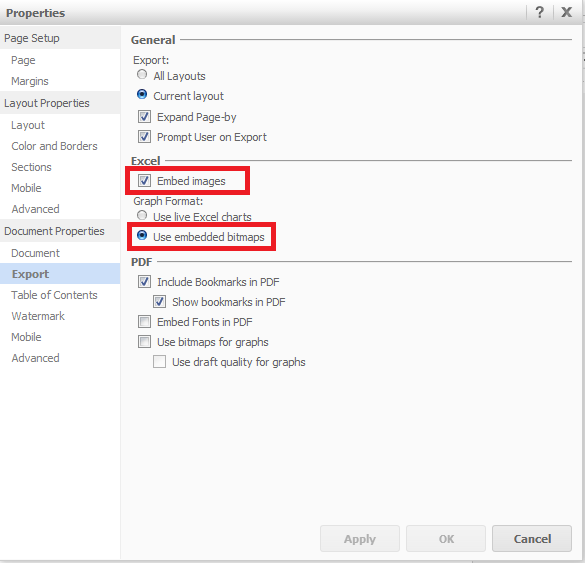
This will result in the graph having the desired x-axis scale after exporting, but will not allow the user to make changes to the graph's content in Excel.


Comment

0 comments

Details

Knowledge Article

Published:

June 16, 2017

Last Updated:

June 16, 2017