EducationSoftwareStrategy.com
StrategyCommunity

Knowledge Base

Product

Community

Knowledge Base

TopicsBrowse ArticlesDeveloper Zone

Product

Download SoftwareProduct DocumentationSecurity Hub

Education

Tutorial VideosSolution GalleryEducation courses

Community

GuidelinesGrandmastersEvents
x_social-icon_white.svglinkedin_social-icon_white.svg
Strategy logoCommunity

© Strategy Inc. All Rights Reserved.

LegalTerms of UsePrivacy Policy
  1. Home
  2. Topics

KB45670: Visual Insight Analysis is not automatically updated upon changing underlying dataset attribute forms in MicroStrategy Web 9.3.1


Community Admin

• Strategy


In MicroStrategy Web 9.3.1, when a report contained in a Visual Insights is modified by changing the displayed attribute forms, the changes are not reflected on the VI Analysis

SUMMARY
This issue has been classified as an enhancement request by Strategy. The impact is limited to Strategy Web 9.x Visual Insight Analysis. There is a workaround available and outlined in this Technical Note. A solution/code fix for this issue is currently not available, but is being reviewed for a future Strategy release.
 
SYMPTOM:
In Strategy Web 9.3.1, when a report contained in a Visual Insights is modified by changing the displayed attribute forms, the changes are not reflected on the VI Analysis.  
STEPS TO REPRODUCE:
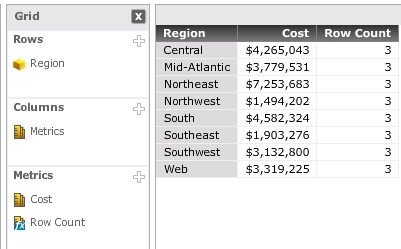
  • Create a simple report with Region on the rows and Cost as a metric.
  • Create a Visual Insight with the afforementioned report and choose the grid option as a Visualization. Save and Close.
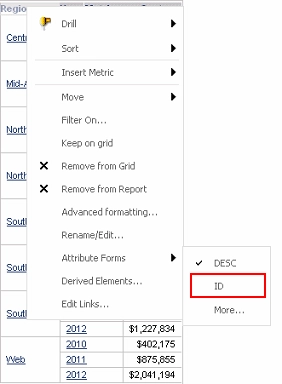
  • Reopen the Report and add the Region's ID form on the grid. Right-click the Region attribute on the grid and select "Attribute Forms" and then "ID".
     
ka04W000001MKqlQAG_0EM4400000026PT.png
  • Return to the VI and observe that the Region attribute is not automatically updated with the new displayed form.
     
ka04W000001MKqlQAG_0EM4400000026Pe.png

 
CAUSE:
This is a known issue in Strategy Web 9.3.1.
 
ACTION:
Starting in Strategy Web 10, users can select which attribute forms to display directly in Visual Insight. Upgrade to this version to take advantage of this functionality.
 
WORKAROUND:
Delete the original grid on the Visual Insight and insert a new visualization in the same Dashboard.
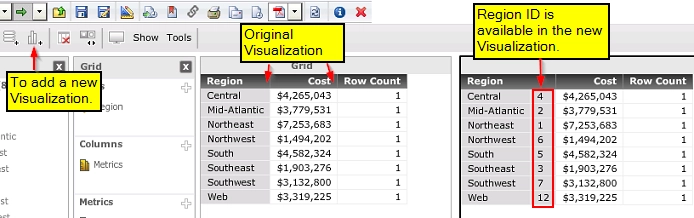
     

ka04W000001MKqlQAG_0EM4400000026Pd.png

 
TO LEARN MORE:
If an Intelligent Cube is used as a dataset for the Visual Insight and the Cube is updated, the changes will be translated in the Visual Insight. Documents and Dashboard have the functionality of adding a dataset as a shortcut. If the report is added to the document/dashboard using this option, then the document would be updated automatically if the grid/graph formatting or layout on the corresponding report is changed. Refer to the following Strategy Knowledge Base technical note for related information:

  • KB18975 - New feauture in MicroStrategy Web 9.0: Add to section as shortcut. 
  • For information about Visual Insight and its functionalities, refer to the Strategy Dashboards and Widgets Creation Guide pg 19 - About Visual Insight: Quick Dashboards

Comment

0 comments

Details

Knowledge Article

Published:

April 5, 2017

Last Updated:

April 5, 2017