SUMMARY
This issue is currently working as designed and there has been an enhancement logged with Strategy technology to improve the functionality. The impact is limited to Horizontal Bar Graphs in Strategy 9.x that use data labels. A couple of workarounds are available in the current document. A solution/code fix for this issue is not available in current releases but is being reviewed for a future Strategy release.
SYMPTOM
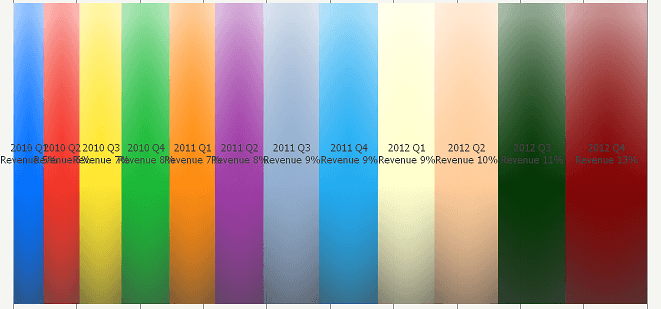
The user creates a Horizontal Bar Graph in Strategy 9.x. If the user adds data labels to the graph, the data labels will overlap and be illegible if the bars are not very wide.
STEPS TO REPRODUCE
1. Create a report with the Quarter attribute and the Revenue metric in the columns
2. Run the report as a Horizontal Bar: Percent Graph
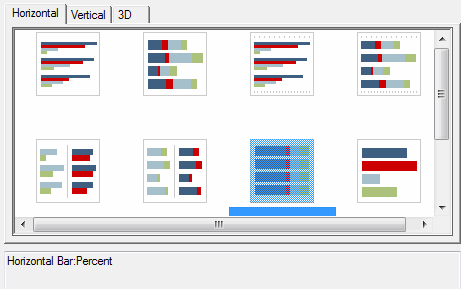
3. Right click the Graph and select Graph Options
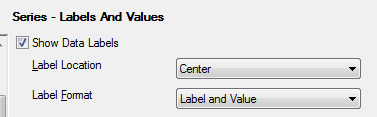
4. In the Graph Properties Window, Navigate to Series > Labels and Values
5. Check the box for Show Data Labels and choose Label and Value in the Label Format drop down.
6. The Data Labels will overlap each other and be illegible.
Video:
You can find a detailed video on how this issue is reproduced and a couple of workarounds here: Tech Note 45735. Steps to reproduce and workarounds
CAUSE
This is working as designed when using a Horizontal Bar Graph. There is not currently an option to move the data labels outside of the Horizontal Bar Graph. An enhancement has been logged with Strategy Technology for this functionality.
ACTION
Contact Strategy Technical Support for an update on this issue. Currently this issue is still being reviewed for feasibility by our Technology team and it is not scoped for any upcoming scheduled Strategy release.
WORKAROUND
There are two possible workarounds to resolve this issue:
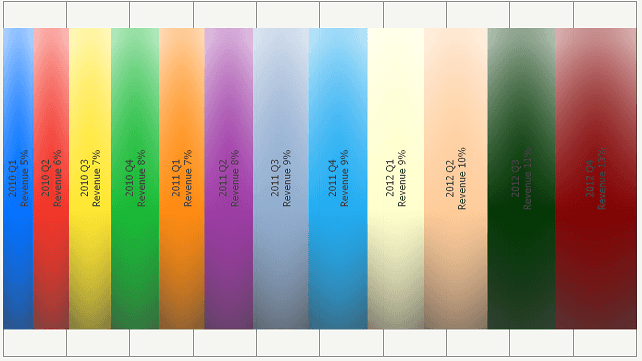
--In Graph Options > Series > Labels and Values > Font, change the rotation to 90. This will allow the data labels to be read on the graph.
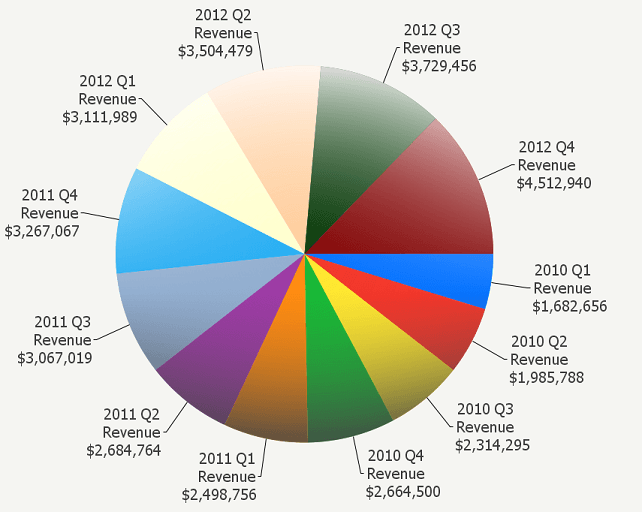
--Change the graph type to pie chart which can have the data labels outside of the slices
ADDITIONAL TROUBLESHOOTING
If the above workarounds do not resolve the issue, please contact Strategy Technical Support with the following information:
--What graph type is being used?
--How are the lables defined?
TO LEARN MORE
Related Tech Notes:
TN 45370The Horizontal bar graph data labels are not displayed for small values in Strategy Mobile App for iPad 9.4.0
TN 18658 The data label for a horizontal bar stacked graph renders behind the graph using Flash in Strategy Web 9.x
Strategy 9.x Basic Reporting Guide Product Manual: Chapter 2 Formatting a Report section: Formatting a graph report
