EducationSoftwareStrategy.com
StrategyCommunity

Knowledge Base

Product

Community

Knowledge Base

TopicsBrowse ArticlesDeveloper Zone

Product

Download SoftwareProduct DocumentationSecurity Hub

Education

Tutorial VideosSolution GalleryEducation courses

Community

GuidelinesGrandmastersEvents
x_social-icon_white.svglinkedin_social-icon_white.svg
Strategy logoCommunity

© Strategy Inc. All Rights Reserved.

LegalTerms of UsePrivacy Policy
  1. Home
  2. Topics

KB45755: How to configure graph series as step lines in Report Services Documents in MicroStrategy Desktop


Community Admin

• Strategy


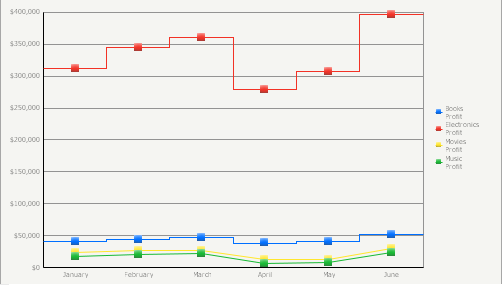
This feature links two successive points on a graph by a step-line rather than just joining them by a straight line.

This feature links two successive points on a graph by a step-line rather than just joining them by a straight line. Step lines use a horizontal line to display the value for a data point on the series, then a vertical line is used to move the line up to the next data point in a series. A step line can make it easier to discern what the values are for each data point on a series than a straight or curved line can. This option is available only for Line, Pareto Percent, Polar, and Stock graphs.
 
An example of a step line in Vertical Line Graph is shown below:
 

ka04W000000OdizQAC_0EM4400000026Ng.png

 
STEPS:

  • Open the Report Services Document in Strategy Desktop 9.x and edit the graph as shown below:
ka04W000000OdizQAC_0EM4400000026Nh.png
  • In the Desktop Toolbar, select Graph> "Graph Options".
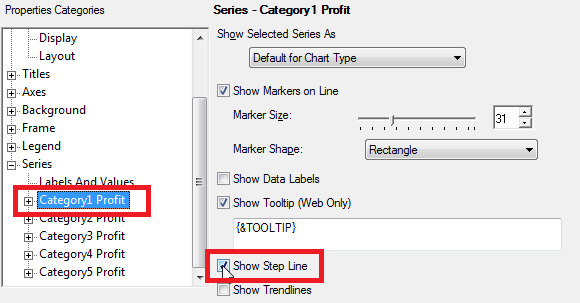
  • In the newly opened window, expand "Series" and select the series that the user wants to show as a step line as shown below:
ka04W000000OdizQAC_0EM4400000026Nj.png
  • In this menu, enable the check box : "Show Step Line". Note: This option is only available on the Line, Pareto Percent, Polar, and Stock graphs.

Comment

0 comments

Details

Knowledge Article

Published:

June 19, 2017

Last Updated:

June 19, 2017