SYMPTOM:
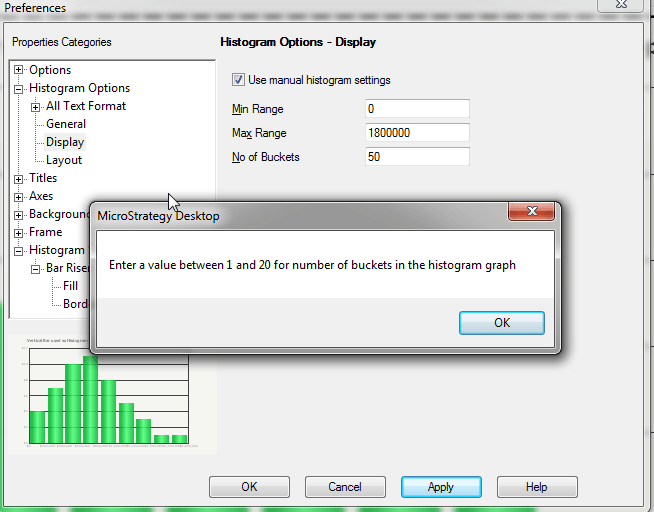
When using the Advanced, Histogram graph type in Strategy Developer 9.x, a user may experience a message telling them to enter a value between 1 and 20 when a value greater than 20 was placed in the "No of Buckets" field in the Histogram Options, Display window. The issue then becomes creating a histogram with more than 20 buckets when the Histogram Options do not allow it.
Sample Code/Error
Enter a value between 1 and 20 for number of buckets in the histogram graph
CAUSE:
This is a limitation of the Advanced, Histogram graph type, specifically for the "No of Buckets" field located in Graph Options, Histogram Options, Display window. The Histogram specific bucket settings appear to be limited to a maximum of 20 buckets for this graph type. An enhancement has been logged to allow for larger bucket sizes to be handled. Contact Strategy Technical Support for an update on this issue.
WORKAROUND:
Since a histogram may be desired to contain more than 20 buckets, and to have all of those buckets to display on the graph itself, then a workaround can be employed using a Vertical Bar Chart, and custom groups containing metric qualifications on the value of an NTile metric. Metric qualifications are employed in this example because they can impact performance far less than custom group banding. This distinction between metric qualifications and custom group banding qualifications is explained in the following tech note:
KB3878 (KB5200-7X0-0017): Custom Group Banding reports time out in MicroStrategy and 8.x
It should also be noted that the method of calculation for a custom group can be toggled by using a few different VLDB properties, specifically: Custom Group Banding Count Method, Custom Group Banding Points Method, and Custom Group Banding Size Method. The custom group can be toggled to use the Analytical Engine or database specific syntax, or to use case statements or temporary tables. Adjusting these properties could have large performance impacts based on the scenario, so these settings could be another option to optimize the fetching and display of data for the histogram. Refer to the Supplemental Reference Guide for System Administration for more information on these VLDB Properties.
Transitioning back to the original workaround option, here are the details on how to display a Histogram with more than 20 buckets using a Vertical Bar Chart, and custom groups containing metric qualifications on the value of an NTile metric:
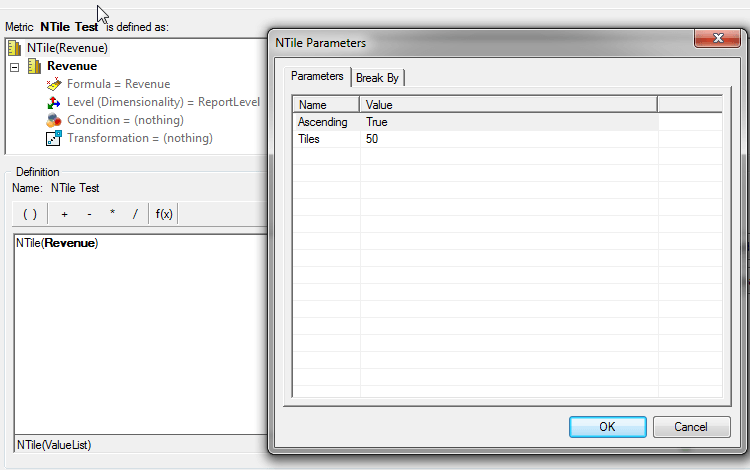
1. Create an NTile metric using the metric which outputs values that should be separated into different buckets. The purpose of the NTile function is to separate the values of data by the specific number of buckets set in the NTile parameters. In the following example, an NTile metric is created with the parameter of 50 buckets:
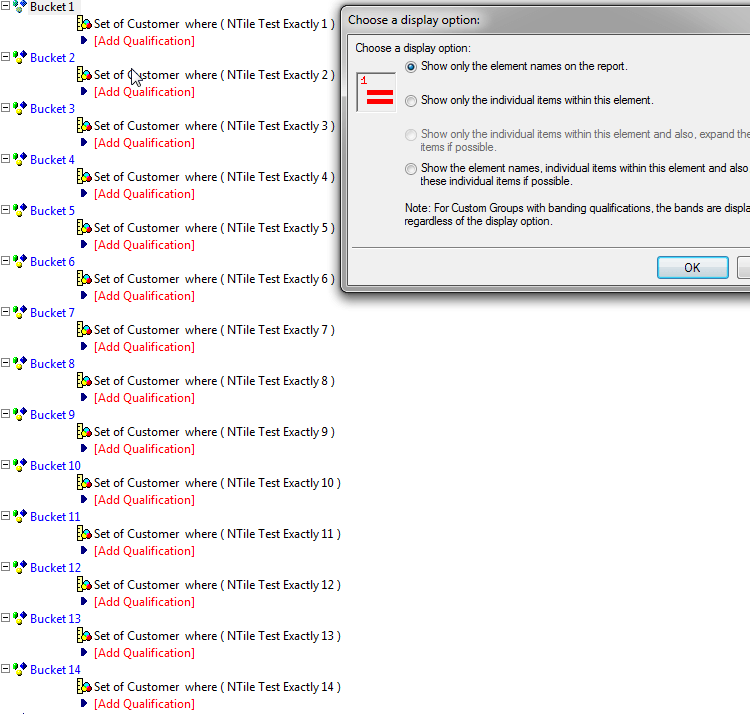
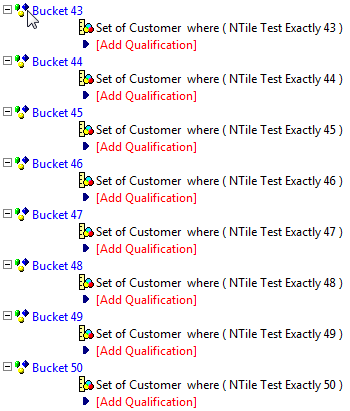
2. Create a custom group that contains the same number of custom group elements as the tiles parameter was set in the NTile metric. This should create one custom group element per bucket. Setting each and every custom group element's "Show Display Options" parameter to the first radio button, "Show only the element names on the report" should provide the desired result of one custom group element per bucket value. In the following example, a custom group was created with 50 custom group elements all containing a metric qualification on the NTile metric for a specific bucket value. The custom group elements were renamed to "Bucket x", where "x" refers to the specific bucket number being qualified on and displayed by that custom group element.
.
...
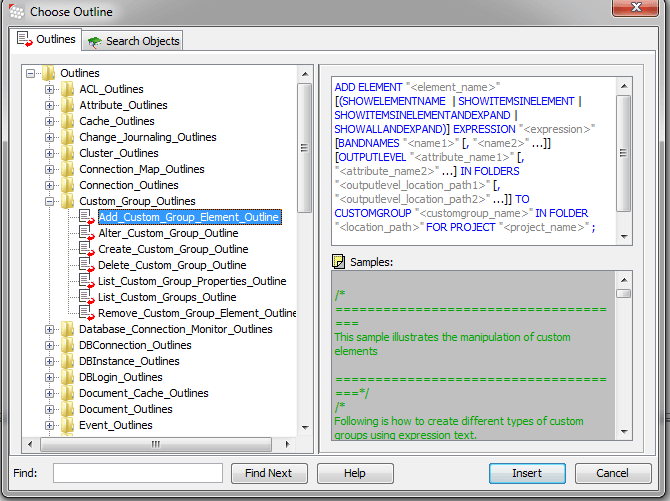
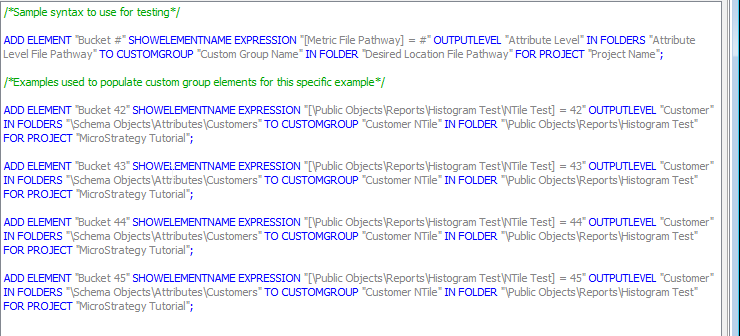
3. Manually creating 50 custom group elements can take quite a large amount of time, so measures can be taken to speed the process up. For example, using the Add_Custom_Group_Elements_Outline found in Outlines, Custom_Group_Outlines in Command Manager to add custom group elements to a specific custom group can be done to streamline the process. In the following example, the script used to quickly add multiple custom group elements to the Customer NTile custom group is provided to demonstrate how the process was employed in this example:
4. Place the custom group and the metric which the NTile metric was using to separate the values into buckets into the report. Execute the report in Graph View, and select Vertical Bar Chart as the graph type. As a result, a vertical bar graph is shown with 15 bars.
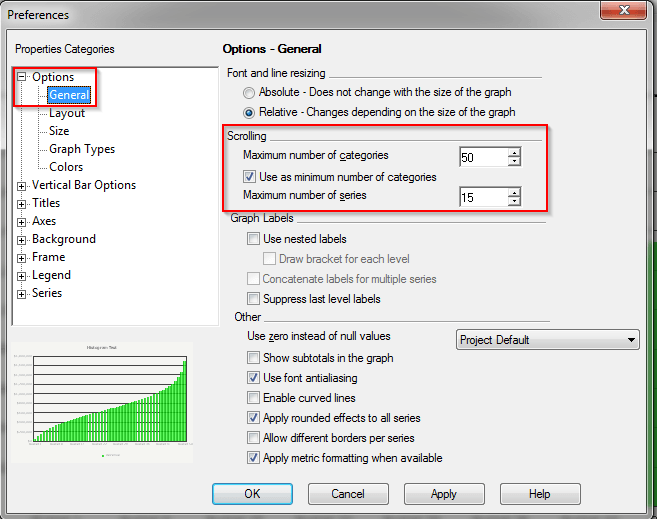
5. To force the graph to display 50 bars instead of 15, right click the graph and select Graph Options. Navigate to Options, General, and adjust the "Maximum number of categories" in the Scrolling section. Setting the "Maximum number of categories" to 50 in this instance, the graph now shows 50 bars instead of just 15.
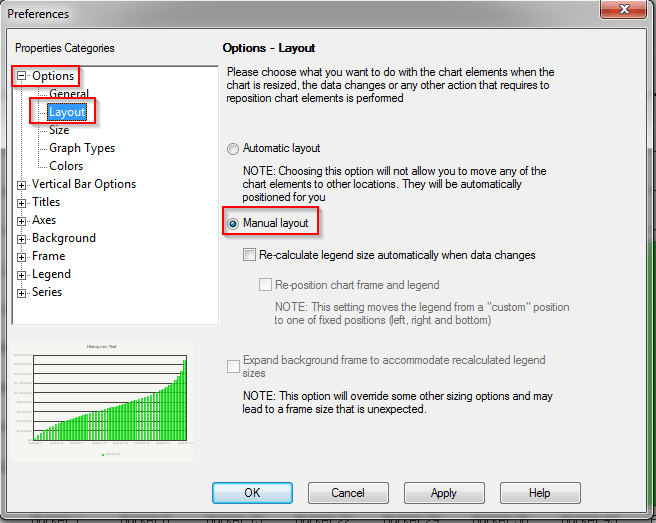
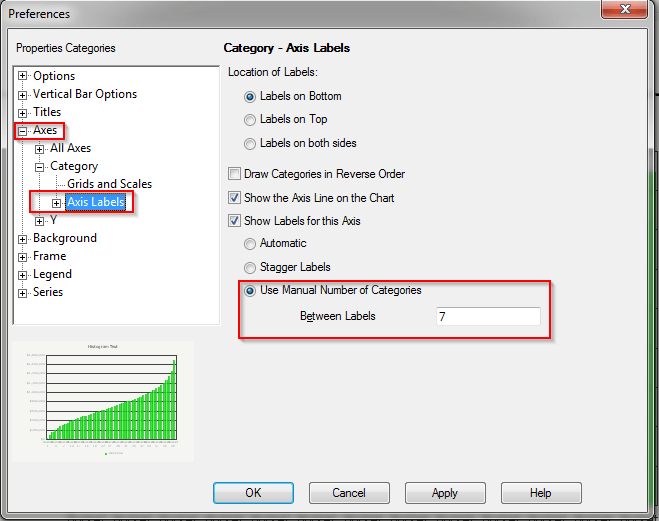
6. To change the default numbering schema on the X Axis of the graph, right click the graph and select Graph Options again. Navigate to Options, Layout, and set the layout mode to Manual. Apply the changes by clicking the Apply button. Next, navigate to Axes, Category, and select the Axis Labels option. Select the radio button for "Use Manual Number of Categories" and enter a new desired numbering scheme for the X Axis. The graph may be seen with the changes after entering a number, hitting the Apply button, and further edits to the numbering scheme can be made until the desired pattern is found.
Further information regarding this process can be found in the following tech note:
KB18247 (KB5700-8X-3178): How to specify a manual number of labels for a graph's category axis in MicroStrategy Desktop 8.x
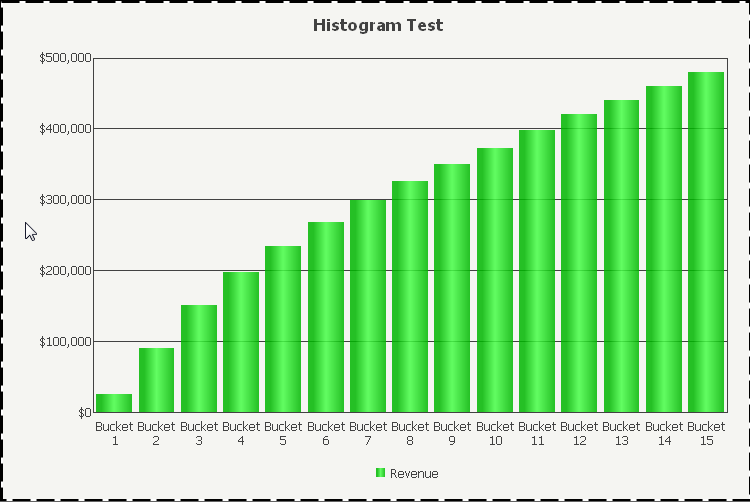
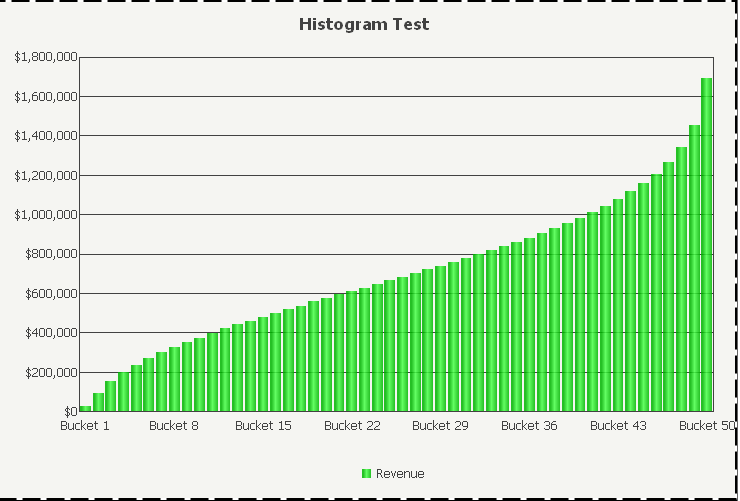
The following example shows the completed graph, which contains all 50 custom group elements acting as buckets due to the NTile metric on a single page, and a formatted display to show every 7 buckets because the desired end result was to see Bucket 1 and Bucket 50, which setting the number scheme to 7 achieved:
KB45838