SYMPTOM:
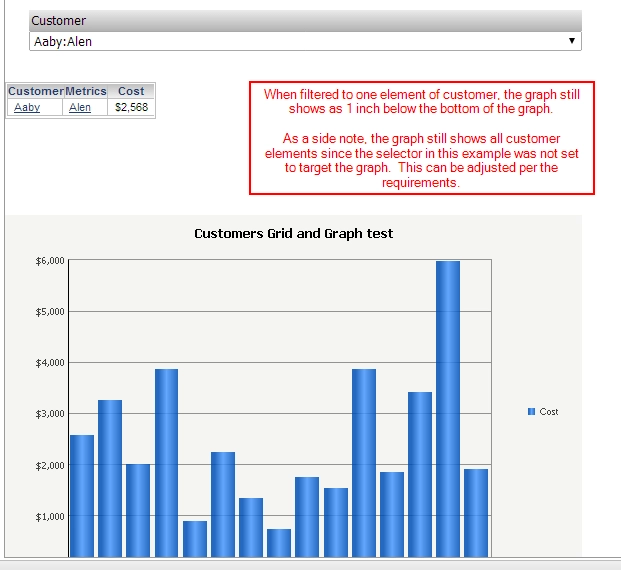
There may exist a requirement that a grid needs to show data in a document, and to have a graph showing a visualization of the data below it. In addition, the graph should be 1 inch below the grid all the time. Furthermore, selectors are placed on the document which filter the grid, so the graph should always be 1 inch below the grid, whether it shows 10,000 rows of data, or 1 row of data.
This requirement can be met utilizing the Insert Section Below feature, the Height Can Shrink property, and the Fit to Contents property for the grid's height, and is demonstrated in Strategy Tutorial below:
1. A standard report is created which will show the data in grid view.
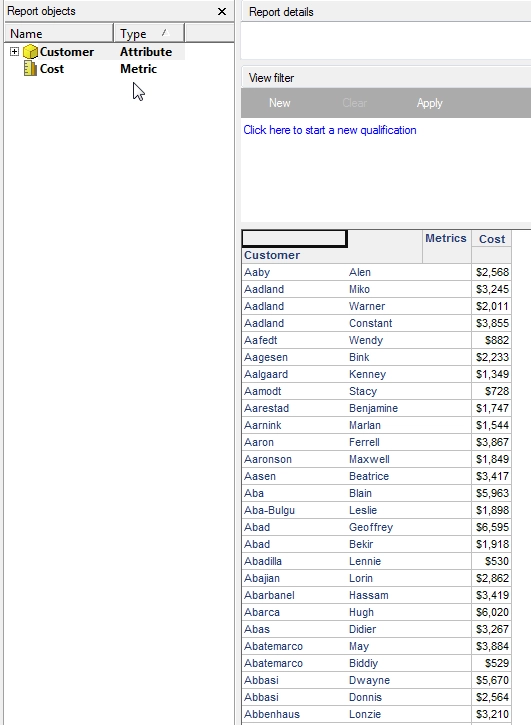

2. A Report Services Document is created from the standard report created in step 1.
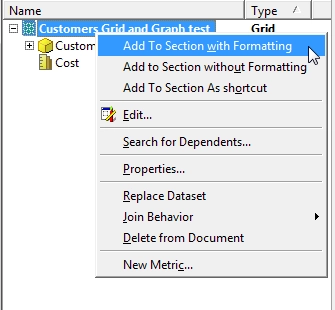
3. Add the grid with formatting to the document's Detail Header section if it is not already there. This can be done by dragging and dropping the grid into the Detail Header section, or by right clicking the dataset itself, and selecting Add to Section with Formatting.
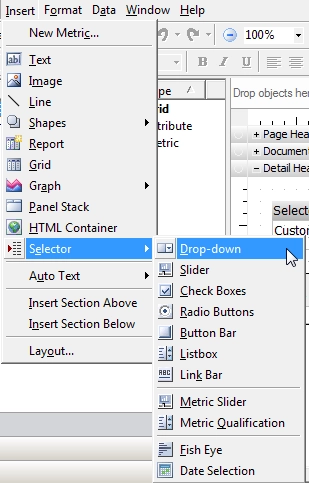
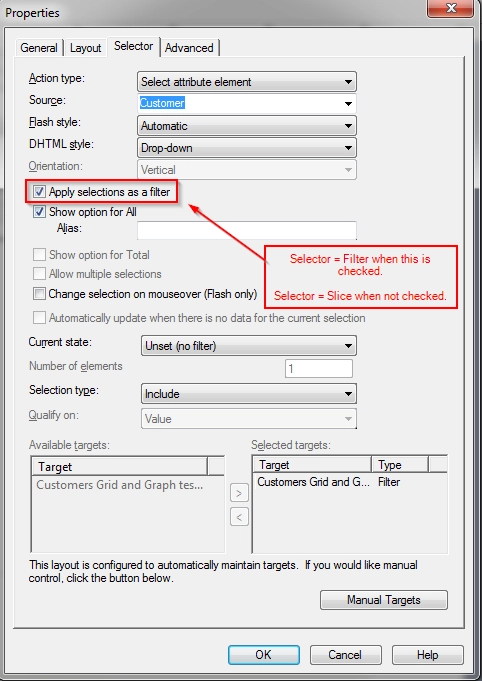
4. Insert a selector above the grid, drag and drop the desired attribute that the selector should show elements for, and set it to either filter or slice the grid. This can be done by navigating to the Insert menu, picking the Selector option, and selecting a drop-down box selector. The filter and slicing options can be set in the selector's properties via right clicking the selector, and selecting Properties.
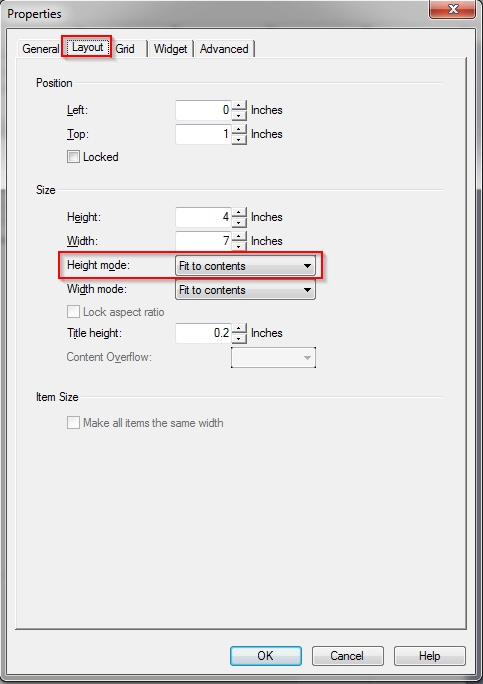
5. Right click the grid object added to the document template in step 3, select Properties and navigate to the Layout tab. Set the grid's Height Mode to Fit to Contents and hit the OK button. This is to ensure that the bottom of the grid object should be set based on the number of rows it returns. For example, a grid with one row should have the bottom of the grid set to the bottom of the only row, whereas a grid that shows 10,000 rows should have the bottom of the grid set to either the bottom of the 10,000th row, or where the section ends (whichever is reached first).
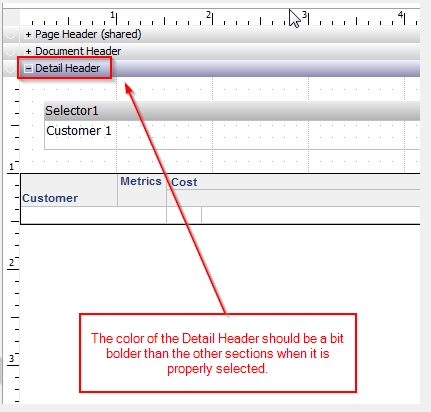
6. Left click the Detail Header section bar, or left click within the background white space within the section to select it. Navigate to the Insert menu, and select Insert Section Below.
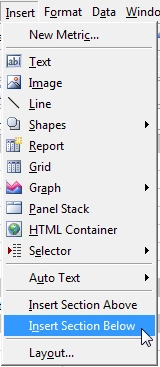
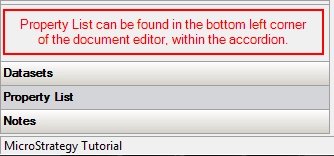
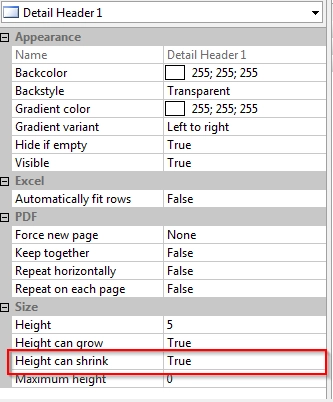
7. Additionally with Detail Header selected, select the Property List option in the accordion, which is located at the bottom left of the document editor. Set the Height Can Shrink property to True for Detail Header 1 (the new section added in the previous step added Detail Header 2, so ensure that the first Detail Header is the one in which this property is set).
8. After setting the Height Can Shrink property, select the new section added within the Detail Header section, which should appear as a thin, but noticeable, grey line. Drag this line up or down so that it is in line with the bottom of the grid object that was added to the Detail Header section.
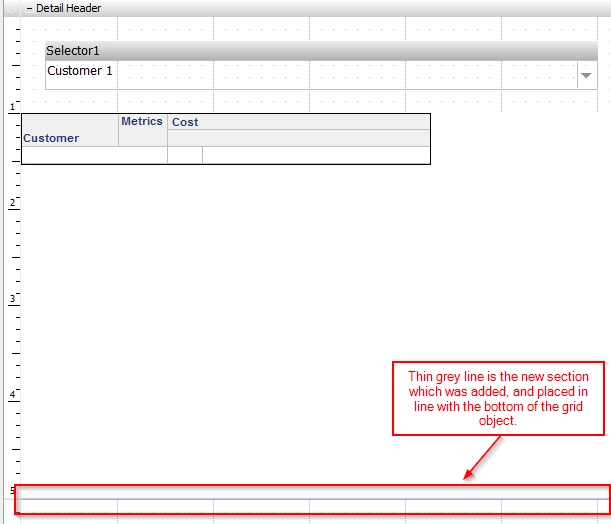
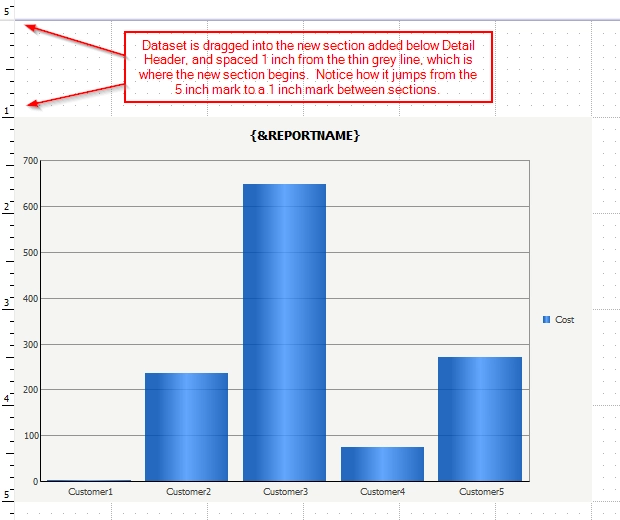
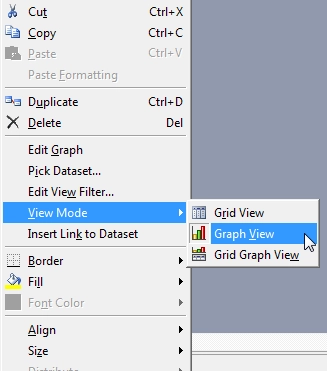
9. Drag and drop the dataset into this new section 1 inch below the grey section line using the rulers above and to the left of the template, and change its view mode to Graph. This can be done by right clicking the grid object after it is added, and selecting View Mode, Graph. In addition, the selector can be set to target the graph object as well to reflect the changes in the grid.
10. As a result, the document template should now have the original report's grid, a selector which either slices or filters the grid, and the graph view of the data contained within the dataset itself.
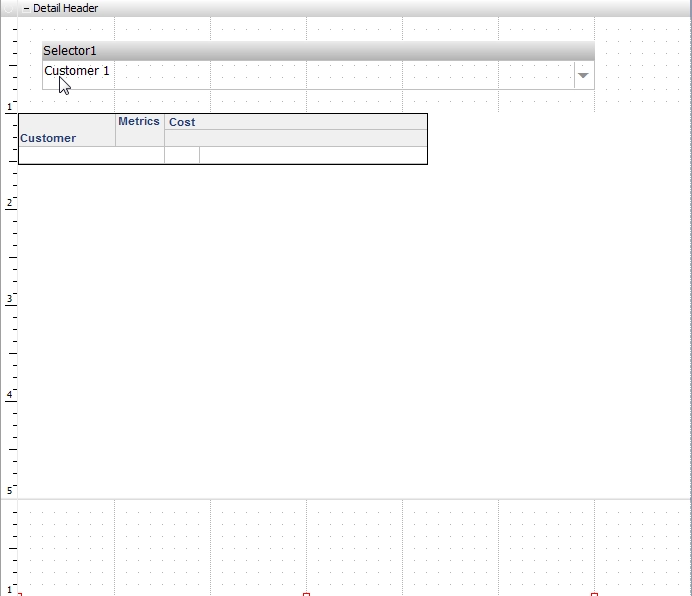
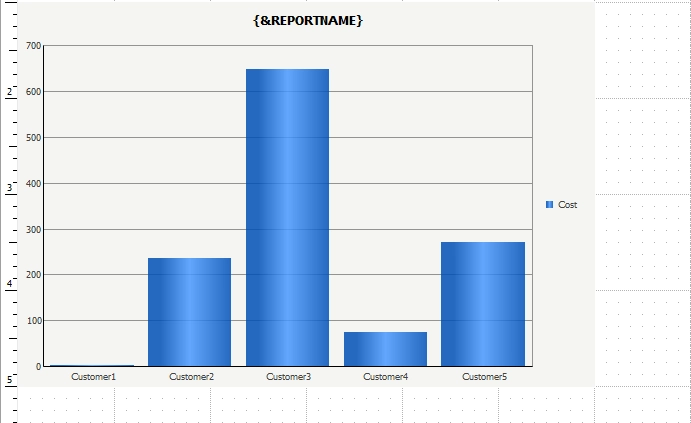
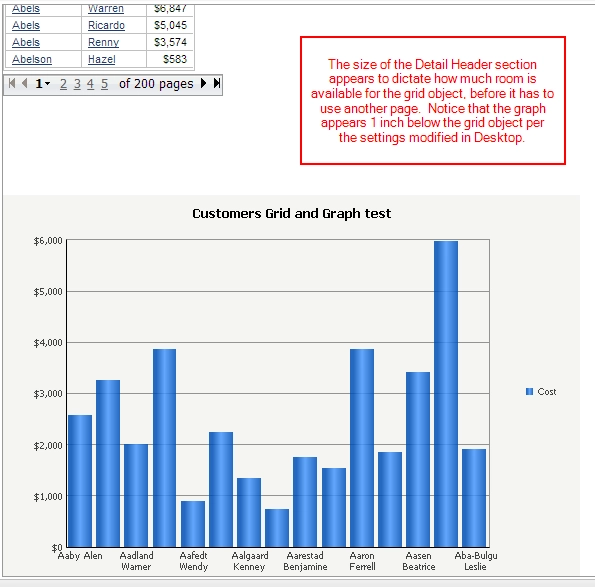
11. When running this document in Web, whenever the selector affects the grid object to show more or less data, the graph should always adjust with it and should always be 1 inch below the grid. In the following example, the original results that shows 10,000 rows has to be scrolled down a bit within the browser in order to find where the grid object ends, and where the graph appears 1 inch below it. In this instance, the grid object ends where the Detail Header section ended in the document editor since it was reached before the 10,000th row, and as such, the rest of the rows can be viewed on subsequent pages.