EducationSoftwareStrategy.com
StrategyCommunity

Knowledge Base

Product

Community

Knowledge Base

TopicsBrowse ArticlesDeveloper Zone

Product

Download SoftwareProduct DocumentationSecurity Hub

Education

Tutorial VideosSolution GalleryEducation courses

Community

GuidelinesGrandmastersEvents
x_social-icon_white.svglinkedin_social-icon_white.svg
Strategy logoCommunity

© Strategy Inc. All Rights Reserved.

LegalTerms of UsePrivacy Policy
  1. Home
  2. Topics

KB45989: Area graph moves beyond the Y axis limits when Curved Area is set to "Enabled" in MicroStrategy 9.x.


Stefan Zepeda

Salesforce Solutions Architect • Strategy


Area graph moves beyond the Y axis limits when Curved Area is set to "Enabled" in MicroStrategy 9.x.

SYMPTOM:
 
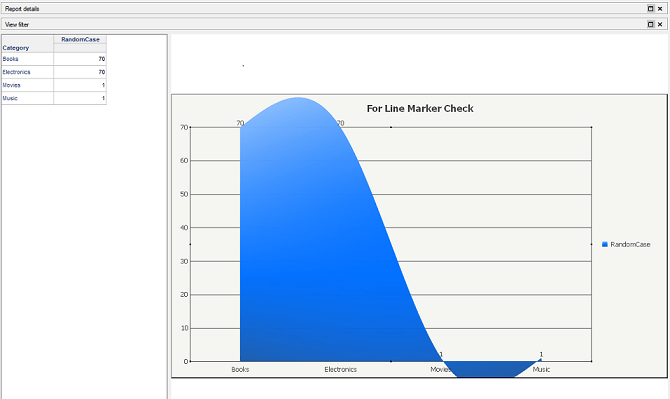
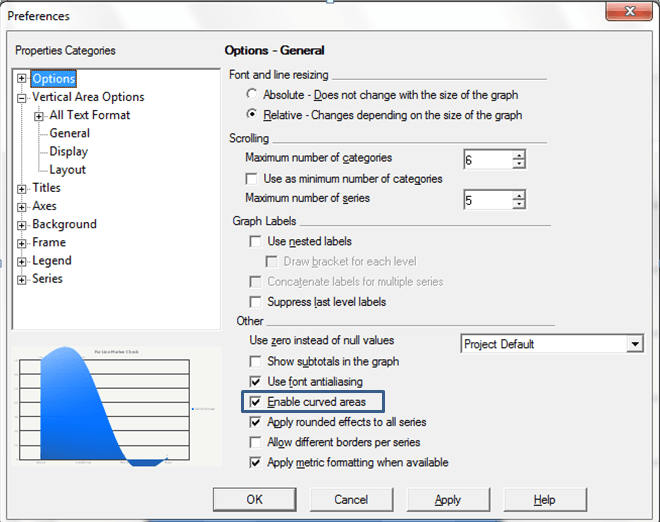
A user attempting to utilize the Curved Area feature of the Area graph by setting that function to "Enabled" may come across the issue where the data displayed surpasses the region defined by the graph.
 

ka02R000000kYYpQAM_0EM440000002CTX.png


ka02R000000kYYpQAM_0EM440000002CTZ.png

CAUSE:
 
This is a known issue in Strategy 9.x.
 
ACTION:
 
Contact Strategy Technical Support for an update on this issue.
 
WORKAROUND:
 
One potential workaround for a user is to extend the Y-axis as far as necessary to envelop the displayed data. However, if the graph is meant to display negative data, a straight-line graph would be preferable.


Comment

0 comments

Details

Knowledge Article

Published:

June 7, 2017

Last Updated:

June 7, 2017