EducationSoftwareStrategy.com
StrategyCommunity

Knowledge Base

Product

Community

Knowledge Base

TopicsBrowse ArticlesDeveloper Zone

Product

Download SoftwareProduct DocumentationSecurity Hub

Education

Tutorial VideosSolution GalleryEducation courses

Community

GuidelinesGrandmastersEvents
x_social-icon_white.svglinkedin_social-icon_white.svg
Strategy logoCommunity

© Strategy Inc. All Rights Reserved.

LegalTerms of UsePrivacy Policy
  1. Home
  2. Topics

KB46061: The Number formatting on the percent axis of a Dual Axis graph is not maintained if one of the percent metrics is removed from the graph through a selector, in MicroStrategy Web


Community Admin

• Strategy


The-Number-formatting-on-the-percent-axis-of-a-Dual-Axis-graph-is-not-maintained-if-one-of-the-percent-metrics-is-removed-from-the-graph-through-a-selector-in-MicroStrategy-Web-9-x

SYMPTOM:
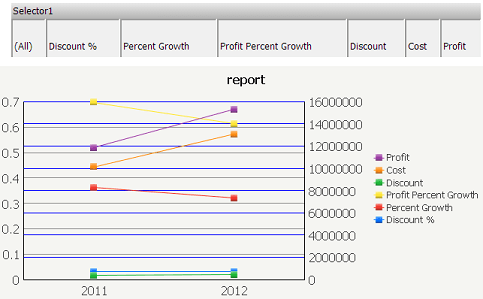
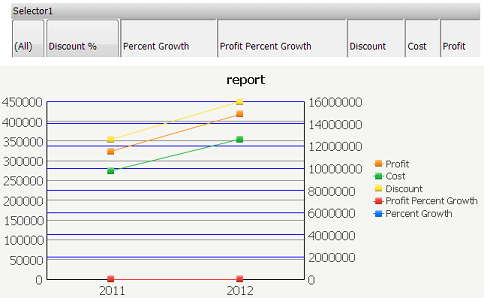
A user creates a dual axis graph in a document, where one of the axes is used only for percent metrics. If this graph is targeted by a selector that allows multiple selections, and one of the percent metrics is deselected to remove it from the current graph display, the number format of the axis will be changed to "general", unless all of the percent metrics are selected in Strategy Web 9.3.x.
With all percent metrics selected:

ka04W000000Oe2WQAS_0EM4400000026Iz.png

 
After deselecting one of the percent metrics:
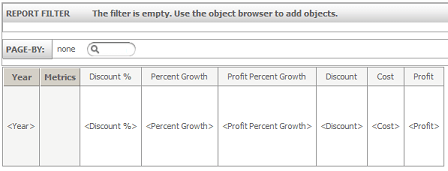
ka04W000000Oe2WQAS_0EM4400000026JA.png

STEPS TO REPRODUCE:
In Strategy Tutorial:

  • Create a report with the Year attribute and Discount %, Percent Growth, Profit Percent Growth, Discount, Cost, and Profit metrics.
     
ka04W000000Oe2WQAS_0EM4400000026JB.png
  •  
    Note: The report template should appear as above.
     
  • Create a document using this report as its dataset.
  • Add this report to the document as a graph.
  • Configure the graph to be of type "Vertical Line: Dual Axis Stacked".
     
ka04W000000Oe2WQAS_0EM4400000026Ix.png
  •  
    Note: This issue is present on all dual-axis graphs.
     
  • Create a "Select Metric" selector of "Button Bar" type.
  • Enable "Show option for All" and "Allow multiple selections". Specify the graph as this selector's target.
     
ka04W000000Oe2WQAS_0EM4400000026J9.png
  •  
    Note: These settings are located on different tabs of the graph object's "Properties and Formatting".
     
  • Execute this document in Interactive Mode.
  • Right-click the graph and select "Format" > "Axes".
  • Select "Manually assign series to each axis" under "Dual Y Options"
  • For the Y1 Axis, select Discount %, Percent Growth, and Profit Percent Growth. Move all other metrics to the other Y2 axis.
     
ka04W000000Oe2WQAS_0EM4400000026J0.png
  •  
    Note: The axes should be configured as indicated above.
     
  • Execute this document again. Notice the graph's Y1 axis is formatted as expected.
     
ka04W000000Oe2WQAS_0EM4400000026Iz.png
  • Use the selector to deselect one of the three percent metrics. In the image below, Discount % has been deselected.
ka04W000000Oe2WQAS_0EM4400000026JA.png
  •  
    Note: The number formatting on the Y1 Axis is lost unless all three percent metrics are selected, as indicated by the second image.

CAUSE:
This is a known issue with Strategy Web 9.3.x.
ACTION:
Strategy will continue to investigate and post updates as soon as they are available
 
WORKAROUND:
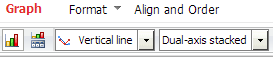
In the "Axes" properties modify the "Axes Values and Scales" properties as indicated in the screenshots below :
 

ka04W000000Oe2WQAS_0EM4400000026J2.png

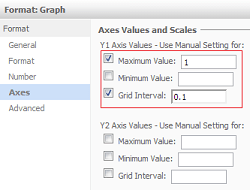
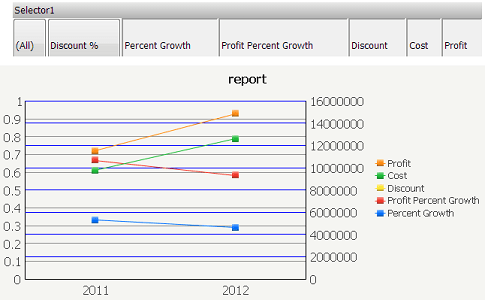
Note: Specifying the "Maximum Value" and "Grid Interval" values produces results as shown below:
 

ka04W000000Oe2WQAS_0EM4400000026JC.png


46061


Comment

0 comments

Details

Knowledge Article

Published:

April 3, 2017

Last Updated:

April 3, 2017