EducationSoftwareStrategy.com
StrategyCommunity

Knowledge Base

Product

Community

Knowledge Base

TopicsBrowse ArticlesDeveloper Zone

Product

Download SoftwareProduct DocumentationSecurity Hub

Education

Tutorial VideosSolution GalleryEducation courses

Community

GuidelinesGrandmastersEvents
x_social-icon_white.svglinkedin_social-icon_white.svg
Strategy logoCommunity

© Strategy Inc. All Rights Reserved.

LegalTerms of UsePrivacy Policy
  1. Home
  2. Topics

KB46217: "Cannot read property mid of null" or "this._docModel is null" error when using ESRI Maps Custom Visualization in a report in MicroStrategy Analytics Enterprise 9.4.1 HF2.


Community Admin

• Strategy


SYMPTOM:
 
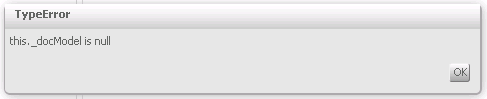
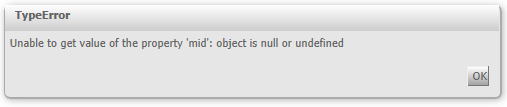
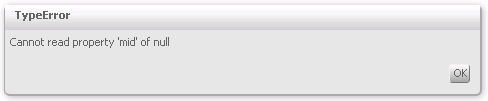
Strategy Web 9.4.1 HF2 users will notice that when configuring the ESRI Maps custom visualization in a report an error message will show up. This error may vary across browsers as shown below:
 
Internet Explorer:


Unable to get value of property 'mid': object is null or undefined
 

ka04W000000OaZzQAK_0EM4400000026I8.png

 
Chrome:


Cannot read property 'mid' of null
 

ka04W000000OaZzQAK_0EM4400000026II.png


Firefox:


this._docModel is null


ka04W000000OaZzQAK_0EM4400000026Hu.png

 
STEPS TO REPRODUCE:

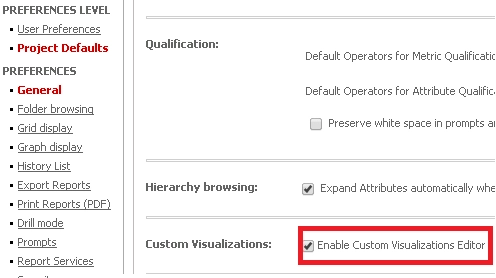
  • Make sure that custom visualizations have been enabled in the Web Preferences > Project Defaults > General > Custom Visualizations as shown below:
ka04W000000OaZzQAK_0EM4400000026I6.png
  • Create a report with an attribute that contains latitude and longitude information in Strategy Web 9.4.1 HF2.
  • Add a metric to this report
  • Unmerge the row and column headers.
  • Under the Tools Menu select "Custom Visualizations"
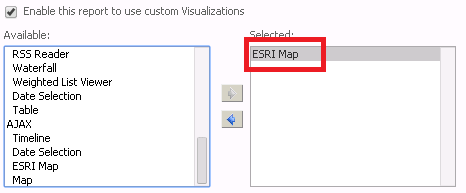
  • Enable custom visualizations for this report and select the ESRI Map Visualization located under the AJAX category as shown below:
ka04W000000OaZzQAK_0EM4400000026IA.png
  • Click on "Visualization Properties"
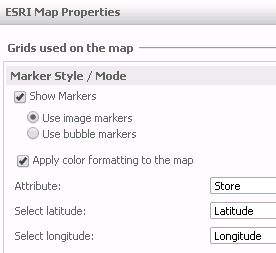
  • Select the attribute or attributes with the correct information in the dropboxes.
  • Enable "Show Markers" and click "OK". A correct configuration is shown below:
ka04W000000OaZzQAK_0EM4400000026IK.png
  • Run the document and notice that the error in the symptom is shown.

CAUSE:
 
This is a known issue with ESRI Maps as custom visualizations in reports.
 
ACTION:
 
This issue is addressed in Strategy Web 9.4.1 Hotfix 3. Please upgrade to this version to take advantage of the fix.
 
WORKAROUND:
 
ESRI Maps will work properly as visualizations in VIsual Insight or as a widget in a Report Services Documents. If possible use these two options instead of a custom visualization in a report.


KB46217


Comment

0 comments

Details

Knowledge Article

Published:

May 24, 2017

Last Updated:

November 16, 2018