The steps below describe a method of double-filtering a grid/graph object in Web 9.4.x using a filter selector combined with a case statement derived metric and view filter. An example of a business case in which this could be useful is using a filter-based slider selector to target a grid/graph object in Web in order to filter it down to a user's desired date range. In this example, the slider selector will enable the choice of beginning month and ending month or the range:
On top of that, it is desired to use the same slider selector to target another grid/graph object but filter it based on a different month range, such as the month range:
Note that this second range is a subset of the first month range, assuming the beginning and ending months are at least four months apart. The steps below outline a method to accomplish this in Strategy Tutorial project using double-filtering based on the slider selector and then a view filter on top of that.
Also, note that in general, Month attribute ID's can require some extra work in order to be able to convert, because in standard format 201101, 201102, 201103... etc representing Jan 2011, Feb 2011, Mar 2011... etc, arithmetic can't be directly applied to the Month ID to transform it. For example, January 2011 minus four months would be September 2010, but 201101 minus 4 does not equal 201009. A mapping like this does not exist in Strategy Tutorial, so it would be up to the developer to implement this in a way they see fit. One way to do this would be to create a new attribute form for the Month attribute, ranking all months increasing order starting from 1 to N where N is the current month. That way, basic arithmetic can be used on that attribute form to convert between months. This will be important when defining the second filtering expression.
1) Log into Strategy Tutorial project in Web and create a very simple new report with only the Month attribute present on the rows. Save and close this report.
2) Right-click on this report in Web and select Create Document from the drop-down list.
3) Drag the dataset into the Detail Header section in order to create a grid object.
4) Add an attribute slider selector to the Detail Header section that sources from the Month attribute. By-default it's target set will include the grid created in step (3). Make sure that the Apply selections as a filter box is checked. Also, in the Layout tab of the Properties and Formatting of the selector, check the box for Allow multiple selections. This will give the slider a start and end point.
5) Create the following three derived metrics and add them to the columns of the grid:
Derived Metric 1
Name: Month ID
Formula: Max(Month@ID){Month}
Notes: -This derived metric calculates at the Month level, so will always be equal to the Month ID value in that row.
Derived Metric 2
Name: Max Selection
Formula: Max(Month@ID){}
Notes: -This derived metric has no set level, so it will choose the maximum of all months.
-This value will dynamically adjust to the maximum value selected by the user on the slider selector created in step (4).
Derived Metric 3
Name: Case
Formula: Case(( = ),1,0)
Notes: -This derived metric uses a case statement with an expression that represents the second filtering condition to be applied.
-The expression tells Strategy Analytical Engine to set the value of the the metric to one for rows in which the Max Selection
metric is equal to the Month ID metric, an zero otherwise.
-Note that as mentioned above, this expression will need to be altered to fit the date range desired. For instance, if the four month
range mentioned above is desired, the metrics must be set up so that a direct arithmetic expression makes sense. In that case,
the expression in the case statement metric may be more similar to: Case(( - <= 4),1,0)
6) At this point, the document should look similar to the screenshot below:
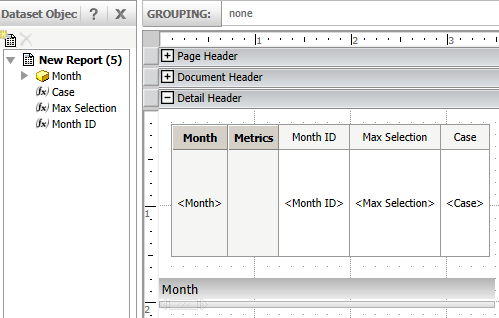
7) The last step is to create a view filter condition that filters the results down to where the Case metric equals one. When this is true, the expression in the case statement will be true and the starting month and ending month will fall in the range specified. This filter will re-apply and hence the displayed data will update every time the slider values are changed.