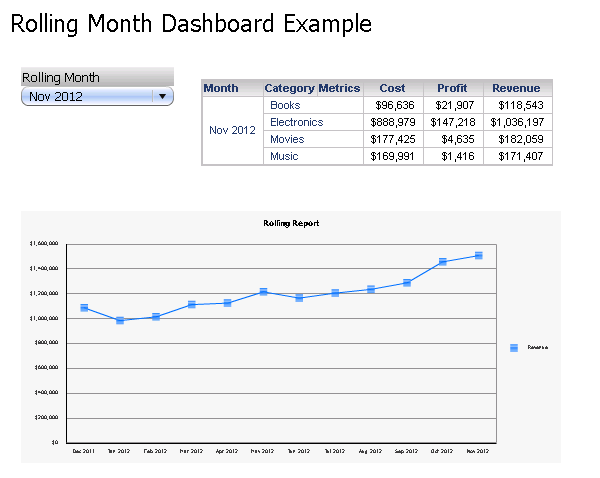
In some situations, it may be useful to display a graph with the last 12 months of data that will adjust depending on which month is chosen. This article describes a method for creating an additional attribute that allows users to use a selector on a document that can display the previous rolling 12 months.
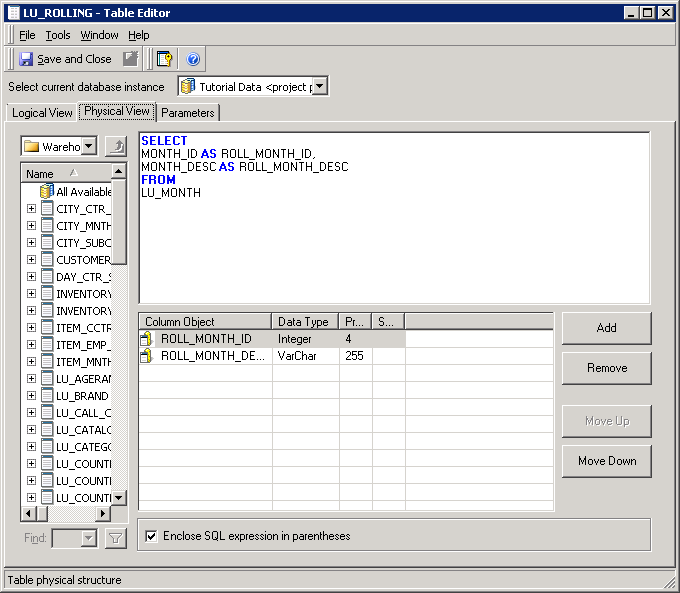
1. Create a logical table to serve as the lookup table for the "Rolling Month" attribute. Use the following SQL statement as an example to define the lookup table:
SELECT

MONTH_ID AS ROLL_MONTH_ID,

MONTH_DESC AS ROLL_MONTH_DESC

FROM

LU_MONTH
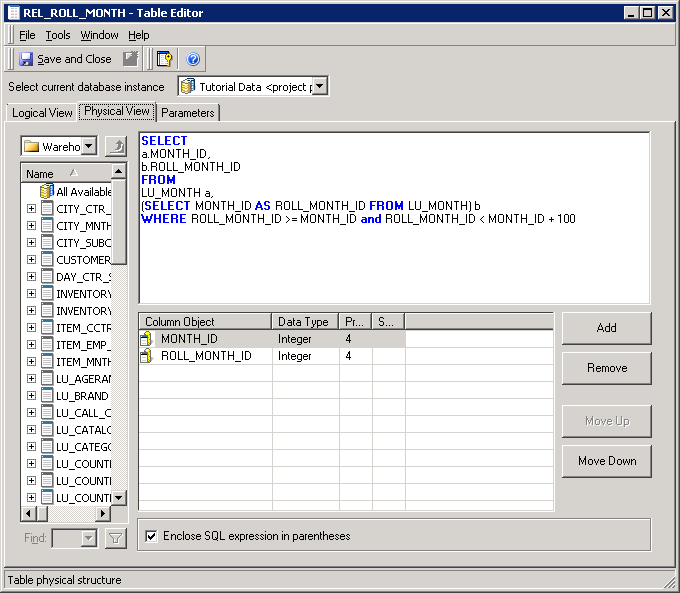
2. Create a logical table that describes the relationship between Rolling Month and Month
SELECT

a.MONTH_ID,

b.ROLL_MONTH_ID

FROM

LU_MONTH a,

(SELECT MONTH_ID AS ROLL_MONTH_ID FROM LU_MONTH) b

WHERE ROLL_MONTH_ID >= MONTH_ID and ROLL_MONTH_ID < MONTH_ID + 100
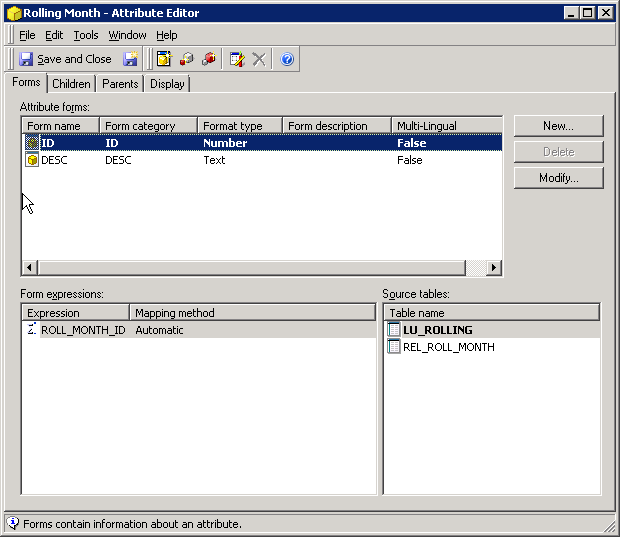
3. Create an attribute called Rolling Month based on the lookup and relationship tables that were just defined. The attribute should have an ID form based on ROLL_MONTH_ID and the description form based on ROLL_MONTH_DESC. The ID should be mapped to both the lookup table and the relationship table.
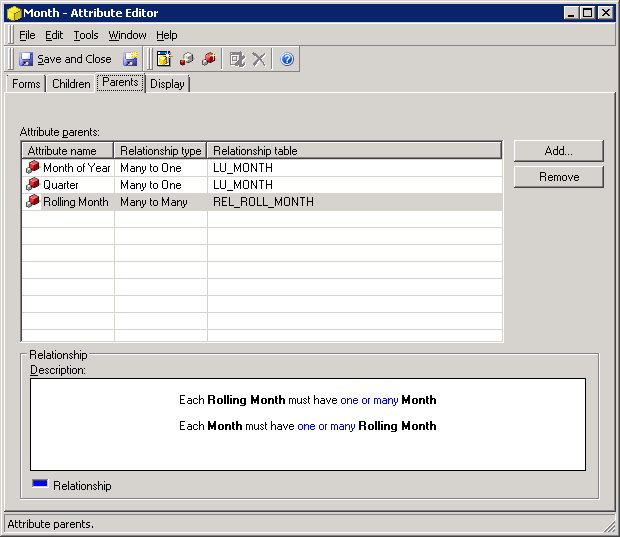
4. Adjust the Month attribute so that it maps to the REL_ROLL_MONTH table. Then add Rolling Month as a parent to the attribute. Set the relationship to many-to-many and the relationship table to REL_ROLL_MONTH. Once changes are made to the attributes, update the schema.
5. Now, on any dataset that will use the Rolling Month selector, add both Month and Rolling Month to the dataset.
6. On the document, create a selector based on the Rolling Month attribute and target any graph that will display the last 12 rolling months. When any month is selected in the Rolling Month selector, the graph will show that month and the previous 12 months.
Optional: If any other grids/graphs should only show one value based on the Rolling Month selector, add a view filter to the report where Month and Rolling Month are the same. For example, the following syntax works with the above method:
Month ID Equals Rolling Month ID
Note: the method described in this article assumes that the data model is set up similar to Strategy Tutorial. The logical table SQL may need to be adjusted depending on the setup of the Month ID, the number of months to show, etc.