SYMPTOM:
As described in the technical note below, it is possible to apply thresholds only on the Data Markers in a Line Graph.
CAUSE:
This feature is working as designed. An enhancement request has been logged to apply threshold on the line connecting two Data Markers that match the same threshold condition in a Graph Line.
ACTION:
This enhancement is currently not on the scope for future releases.
WORKAROUND:
As a workaround, use a similar Graph shape, as shown below:
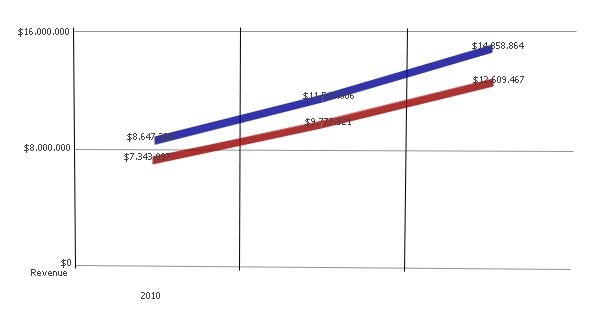
Follow the steps below to apply this workaround:
1 - In Strategy Developer, edit the graph and navigate to Vertical Line Options > Layout:
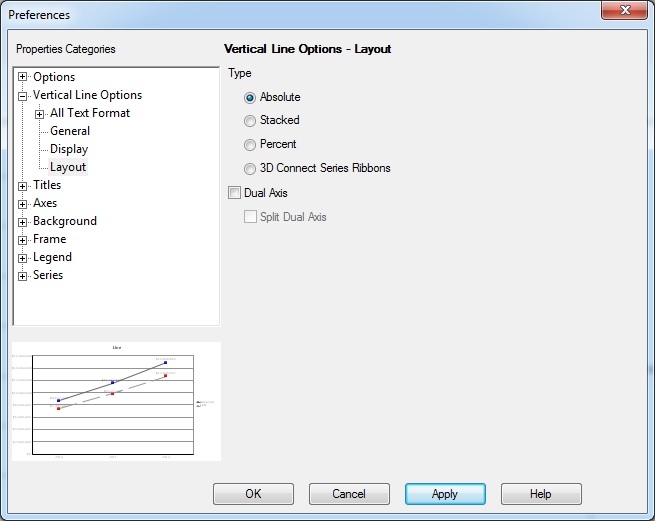
Select the 3D Connect Series Ribbons option, as shown:

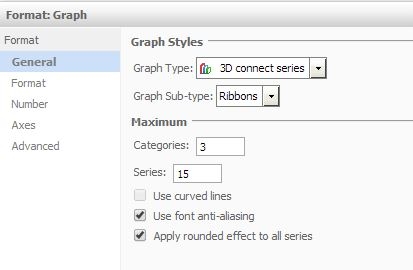
Or, in Strategy Web, format the graph and select the type to be 3D Connect Series and sub-type Ribbons, as shown:
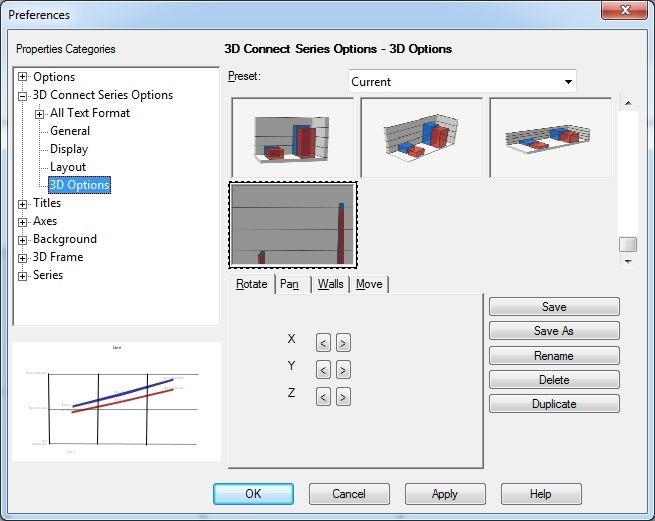
2 - Edit the graph to look like a line graph in the 3D Connect Series Options > 3D Options, by modifying the Rotation, Pan and Walls levels, as shown below:
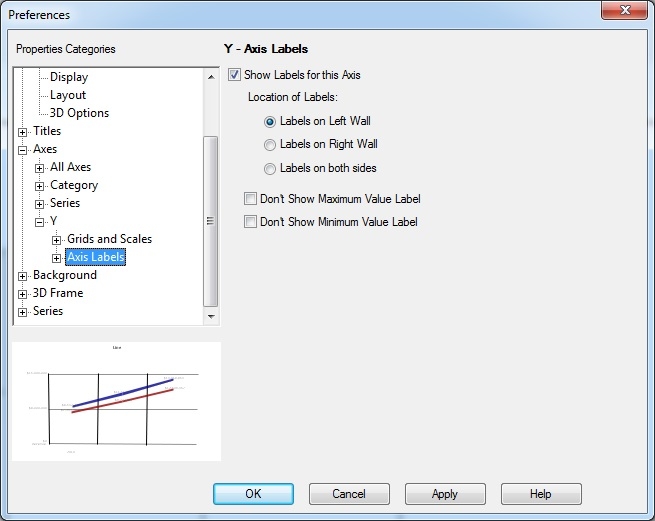
3 - Edit the graph to have the axis labels only in the left side in the Axes > Axis Labels as shown below:
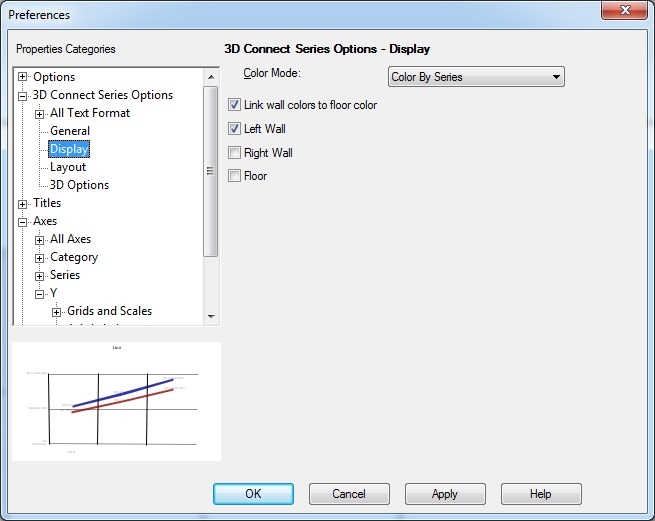
4 - Edit the graph to have only the left Wall in the 3D Connect Series Options > Display as shown below: