EducationSoftwareStrategy.com
StrategyCommunity

Knowledge Base

Product

Community

Knowledge Base

TopicsBrowse ArticlesDeveloper Zone

Product

Download SoftwareProduct DocumentationSecurity Hub

Education

Tutorial VideosSolution GalleryEducation courses

Community

GuidelinesGrandmastersEvents
x_social-icon_white.svglinkedin_social-icon_white.svg
Strategy logoCommunity

© Strategy Inc. All Rights Reserved.

LegalTerms of UsePrivacy Policy
  1. Home
  2. Topics

KB46842: How to interpret dimensionality symbols in the metric editor of MicroStrategy Developer


Stefan Zepeda

Salesforce Solutions Architect • Strategy


This article describes the dimensionality symbols available in metrics.

In a Strategy Developer metric definition, the dimensionality information always appears within braces ( { } ), and uses a distinct syntax. To show the full syntax, in the metric editor, go to View > Show Level (Dimensionality) Properties.
 
The dimensionality consists of a list of expressions, separated by commas. Each expression represents one entry in the dimensionality.
Each entry consists of three parts:
     1.    The level part is the name of an attribute or hierarchy to which the metric should be aggregated. If the name of the attribute or hierarchy contains more than one word, it will appear within brackets ( ). Also, the level can be 'report level', represented by the tilde (~) symbol.
 
     2.    The grouping part comes before the level part and uses the following symbols:
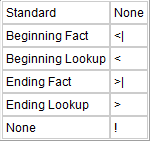
           

ka02R000000kcXmQAI_0EM440000002CNz.png

 
     3.    The filtering part comes after the level part and uses the following symbols:
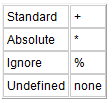
           

ka02R000000kcXmQAI_0EM440000002CO3.png

 
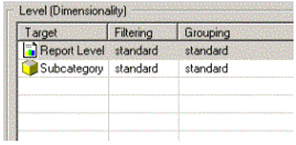
For example, the following dimensionality grids would be represented as shown in the Metric Editor:
      Example 1:
     

ka02R000000kcXmQAI_0EM440000002CNx.png


Sum(Revenue) {~+, Subcategory+}

 
      Example 2:
     

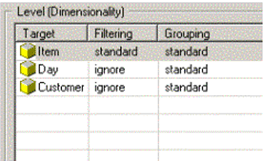
ka02R000000kcXmQAI_0EM440000002CO1.png


Sum(Revenue) {Item+, Day%, Customer%}

 
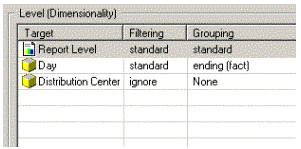
      Example 3: 
     

ka02R000000kcXmQAI_0EM440000002CNp.png


Sum(Revenue) {~+, >|Day+, ![Distribution Center]%}

 
The dimensionality information can always be typed using these symbols instead of using the graphical grid, if preferred. For more information about how dimensionality is used, please see the Strategy Advanced Reporting Guide, which is automatically installed with the Strategy software.


Comment

0 comments

Details

Knowledge Article

Published:

April 13, 2017

Last Updated:

April 13, 2017