The following example explains a scenario which shows the percentage to the value in a summary table.

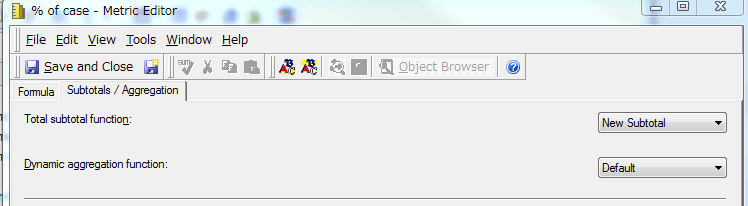
‘% of case’ metric calculation:
The denominator value for 201310 is 300. The values on the row are 30/300(10%), 10/300(3.3%)...
The denominator value for 201311 is 400. The values on the rows are 20/400(5%), 8/200 (2%)…
Subtotal on the column calculation:
The denominator value for 201310 is 300. The value on the row is 53/300(17.7%).
The denominator value for 201311 is 400. The value on the row is 43/400(10.5%).
Subtotal on the row calculation:
Total value for the months is 300+400+500=1200.
The value on TEL column is 65/1200(5.4%)
The value on EMAIL column is 26/1200(2.2%)
The warehouse tables:
Lookup Table
Comm_ID | DESC |
1 | TEL |
2 | EMAIL |
3 | FAX |
4 | Web |
Summary Table (This is not aggregation of the fact table below)
Month_ID | BASE_COUNT |
201310 | 300 |
201311 | 400 |
201312 | 500 |
Fact Table
C_ID | Month_ID | Comm_ID | USER_COUNT |
1 | 201310 | 1 | 30 |
2 | 201310 | 2 | 10 |
3 | 201310 | 3 | 5 |
4 | 201310 | 4 | 8 |
5 | 201311 | 1 | 20 |
6 | 201311 | 2 | 8 |
7 | 201311 | 3 | 4 |
8 | 201311 | 4 | 10 |
9 | 201312 | 1 | 15 |
10 | 201312 | 2 | 8 |
11 | 201312 | 3 | 9 |
12 | 201312 | 4 | 4 |
The following steps explain how to create the metrics for the report above:
1. Create the metrics as follows:
[# of case] metric:
Sum([USER_COUNT]) {~+}
Sum([BASE_COUNT]) {~+}([# of case] / [Total case])
(Sum([# of case]) {@ } / (Sum([Total case]) {@ } / Count(Comm) {@ } ))