EducationSoftwareStrategy.com
StrategyCommunity

Knowledge Base

Product

Community

Knowledge Base

TopicsBrowse ArticlesDeveloper Zone

Product

Download SoftwareProduct DocumentationSecurity Hub

Education

Tutorial VideosSolution GalleryEducation courses

Community

GuidelinesGrandmastersEvents
x_social-icon_white.svglinkedin_social-icon_white.svg
Strategy logoCommunity

© Strategy Inc. All Rights Reserved.

LegalTerms of UsePrivacy Policy
  1. Home
  2. Topics

KB47494: Pie graphs display multiple pies instead of a single pie in MicroStrategy Web 9.x.


Community Admin

• Strategy


A user creates a pie graph in design mode on a dashboard, but when viewed in interactive mode multiple graphs are displayed instead of one

SYMPTOM:
 
In Strategy Web 9.x, a user creates a pie graph in design mode on a dashboard, but when viewed in interactive mode multiple pies are displayed, like shown below, rather than one as expected.

ka04W000000OfUNQA0_0EM440000002653.png

 
STEPS TO REPRODUCE:
 
Follow these steps to reproduce in a Strategy Tutorial Project.

ka04W000000OfUNQA0_0EM44000000264y.png
  • In Strategy Web 9.x, select 'New Document' and then 'Blank Dashboard', and add a data set.
  • Click on the Insert menu > Graph > select Pie, like shown below.
ka04W000000OfUNQA0_0EM44000000264w.png
  • Enable the Graph Zones, as shown below:
  • Drag an attribute to the Category drop zone and a metric to the series drop zone.
  • Run in Interactive Mode.
  • Shown is the undesired pie graph display.
ka04W000000OfUNQA0_0EM440000002653.png

 
CAUSE:
 
This is working as designed in Strategy Web 9.x. The display of a pie chart depends on the arrangement of the attributes and metrics in the rows and columns, or categories and series of the report.
 
Placing the attribute in the row and the metric in the column will result in a single pie graph, like shown below.

ka04W000000OfUNQA0_0EM44000000264o.png

 
Placing the metrics in the row and the attribute in the column will result in multiple pie graphs, like shown below.
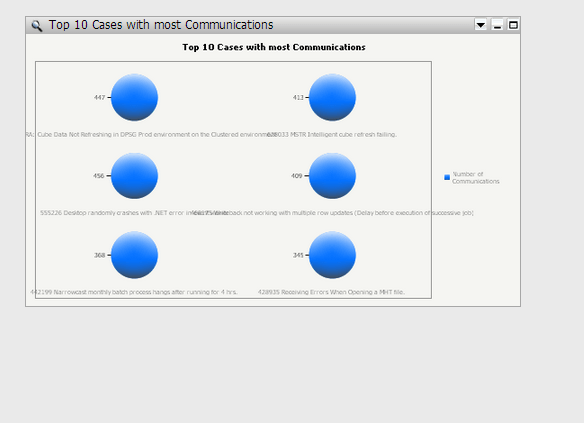
ka04W000000OfUNQA0_0EM44000000264u.png

 
ACTION:
 
Follow one of these options to change the behavior.
 
Option 1:

  • In Editable mode, right click the graph and select 'Format Graph'.
  • Under 'Advanced', change the 'Set Series Properties' to 'By Column', like shown below:
ka04W000000OfUNQA0_0EM440000002650.png
  • Then run in interactive mode to display the change in the graph.

Option 2:

  • Return to Design Mode.
  • Right click on the pie graph's top left corner cross-hair icon.
  • Select "Swap Rows and Columns"
ka04W000000OfUNQA0_0EM440000002651.png
  • Then run in interactive mode to display the change in the graph.


Comment

0 comments

Details

Knowledge Article

Published:

April 7, 2017

Last Updated:

April 7, 2017