Users may wish to perform the Shapiro-Wilk test to check the normality of the samples and to display the P-value in their reports. This technical note shows one way to accomplish this requirement.
This is best illustrated through the example below.
PREMISE:
- Following the instructions in TN: 43665, the Strategy R Integration Pack has already been installed on the Intelligence Server.
STEPS:
1. In the Strategy Tutorial Project, create a report with the Month attribute and Units Sold metric. This technical note assumes that the user wishes to perform the Shapiro Wilk test on the metric.
2. Write an R script as follows
# To hold the values of metric sent by Strategy
df <- data.frame(UnitsSold)
# Perform the Shapiro Wilk test to check the normality and store the results in shapiroResult
shapiroResult <- shapiro.test(df$UnitsSold)
# Add a new column to the data frame; extract the P-value to populate it
df$Pvalue <- shapiroResult$p.value
# 'finalOutput' is the one sending back to Strategy
finalOutput <- df$Pvalue
3. Open the above script in the deployR utility and set the inputs and outputs as follows:

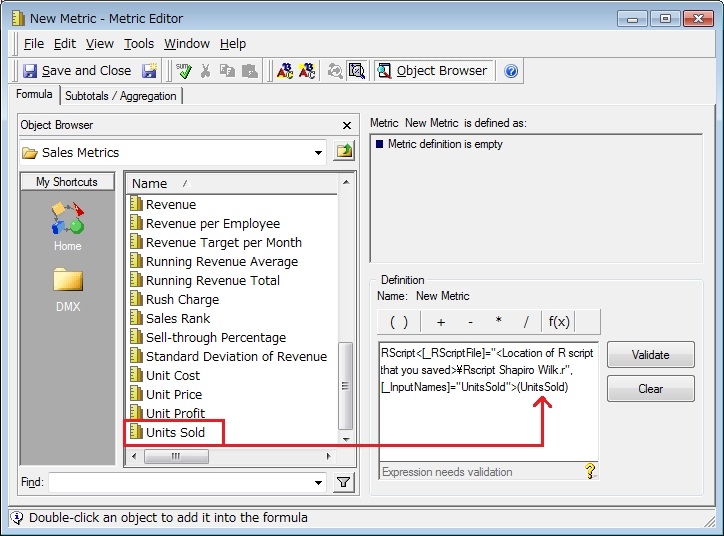
4. Create a stand-alone metric based on the RScript. Replace the last parameters by the Units Sold metric that is incorporated in the report created in Step 1

5. Add the stand-alone metric to the report, run it, and change the format to be able to display the decimals. The added metric will display the P-value of the Shapiro Wilk test result as shown below.

