EducationSoftwareStrategy.com
StrategyCommunity

Knowledge Base

Product

Community

Knowledge Base

TopicsBrowse ArticlesDeveloper Zone

Product

Download SoftwareProduct DocumentationSecurity Hub

Education

Tutorial VideosSolution GalleryEducation courses

Community

GuidelinesGrandmastersEvents
x_social-icon_white.svglinkedin_social-icon_white.svg
Strategy logoCommunity

© Strategy Inc. All Rights Reserved.

LegalTerms of UsePrivacy Policy
  1. Home
  2. Topics

KB47721: Tooltip in Heat Map visualization shows the incorrect subtotal value even though 'smart metric' is enabled in MicroStrategy 9.4.x.


Community Admin

• Strategy


Tooltip in Heat Map visualization shows the incorrect subtotal value even though 'smart metric' is enabled in MicroStrategy 9.4.x.

SYMPTOM:
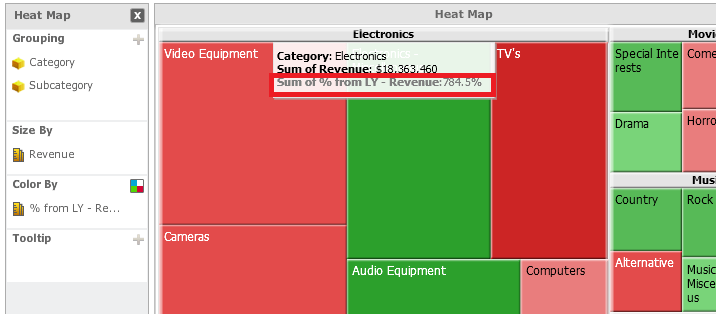
In Strategy Web 9.4.x, the tooltip in Heat Map visualization shows the incorrect subtotal value even though 'smart metric' is enabled, as shown in the image below:
ka04W000000OhFxQAK_0EM44000000264d.png

 
STEPS TO REPRODUCE:
Follow the steps below to reproduce the issue with Strategy Tutorial project:
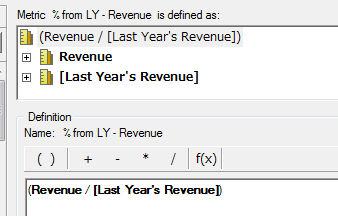
  • Create a metric which shows year-on-year rate, as shown below:
ka04W000000OhFxQAK_0EM44000000264P.png
  •  
    Make sure ‘Allow Smart Metric’ option is enabled.
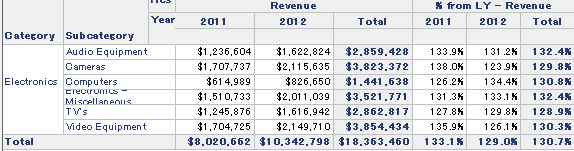
  • Create a dashboard with Category, Subcategory attributes, Revenue metric and the metric (% from LY – Revenue’) created at Step_1.
  • Note that subtotal of ‘% from LY - Revenue’ metric for Electronics shows the incorrect value, 784.5%, while the grid shows the value correctly, as shown in the image below:
ka04W000000OhFxQAK_0EM44000000264e.png

CAUSE:
This is a known issue with Strategy Web 9.4.x
ACTION:
Please upgrade to 9.5.1 to take advantage of the fix.


Comment

0 comments

Details

Knowledge Article

Published:

May 29, 2017

Last Updated:

May 29, 2017