In Strategy Analytics Platform, the MCE trace helps provide backend analysis of Multi-Cube Engine activity.The Multi-Cube engine is the engine that handles dataset joins on a report services document grid.
To enable the MCE trace, follow the steps below:
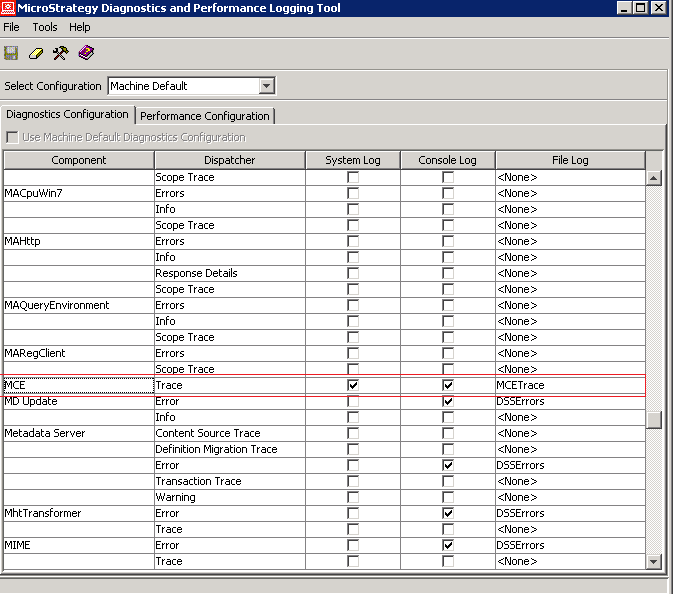
1. Open the Diagnostics and Performance Logging Tool from the Strategy Intelligence Server machine.
2. From the Select Configuration drop-down list, select Machine Default to configure logging for this machine only or for the entire server instance:
o To configure logging only for this machine, select Machine Default.
o To configure logging for the server instance, select CastorServer Instance.
o To configure the server instance with the logging settings that are currently used by this machine, select CastorServer Instance and then select the Use Machine Default Diagnostics Configuration check box.
3. Select the Diagnostics Configuration tab.
4. Select the component MCE.
5. To log information about a component to the operating system log file, select the System Log check box for that component.
6. To log information about a component to the Strategy Monitor console, select the Console Log check box for that component.
7. To log information about a component to a Strategy log file, in the File Log drop-down list for that component, select the log file.
8. From the File menu, select Save. The new settings are saved in the registry.
Example
For a document that contains three cubes and when the metrics comes from different cubes in the grid, the MCE trace displays the subset and join process as given below:
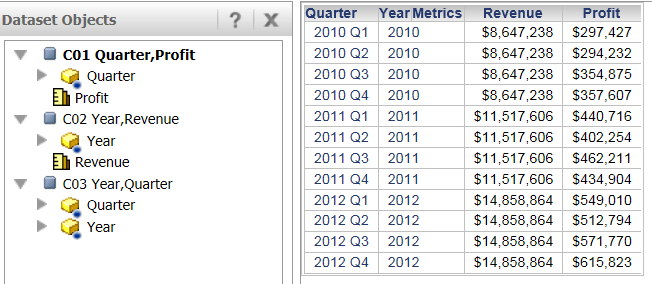
[PID:4740][THR:3296][MCE][Trace]
select [Year]@[YEAR_ID],
 [Quarter]@[QUARTER_ID]
from C03 Year,Quarter
to RELATION0-<Year, Quarter>
select *
from Full Outer Join(
                 Left Outer Join(
                                 C02 Year,Revenue,
                                 RELATION0-<Year, Quarter>
                                ) on Year,
                 Left Outer Join(
                                 C01 Quarter,Profit,
                                 RELATION0-<Year, Quarter>
                                ) on Quarter
                ) on Quarter, Year