EducationSoftwareStrategy.com
StrategyCommunity

Knowledge Base

Product

Community

Knowledge Base

TopicsBrowse ArticlesDeveloper Zone

Product

Download SoftwareProduct DocumentationSecurity Hub

Education

Tutorial VideosSolution GalleryEducation courses

Community

GuidelinesGrandmastersEvents
x_social-icon_white.svglinkedin_social-icon_white.svg
Strategy logoCommunity

© Strategy Inc. All Rights Reserved.

LegalTerms of UsePrivacy Policy
  1. Home
  2. Topics

"Color By" threshold not applied to a Custom Image Layout using MicroStrategy Analytics Desktop (MAD) 9.4.1.6


Benjamin Reyes

Vice President, Product Management • MicroStrategy


Starting with the release of Strategy ONE (March 2024), dossiers are also known as dashboards.

Description

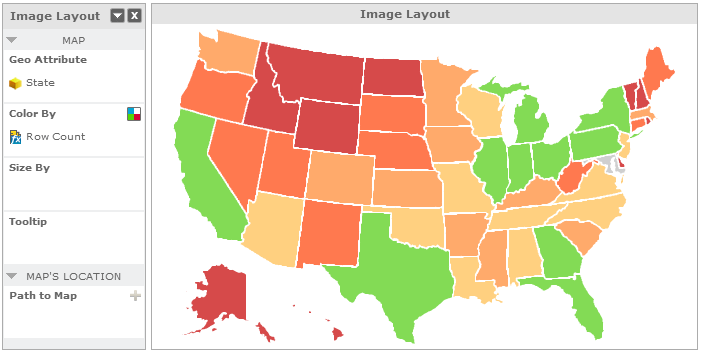
With Strategy Analytics Desktop (MAD) 9.4.1.6, users are able to add their own custom image layouts.  To showcase this description, the steps below duplicate the out of the box States of USA image layout which, by default, showcases the threshold colors correctly. View the following image for reference: 
 

ka0PW0000001JZRYA2_0EM44000000260c.png


Steps to reproduce

The following are steps to reproduce a copy of the State of USA image layout:
  1. Make a copy of the ..\Strategy\Client\resources\webapp\VisFramework\map\USAMapCoords. 

    Rename the copied file to USAMapCoords55.html
  2. Add the following line to the ..\Strategy\Client\resources\webapp\VisFramework\map\ShapeFileMap.xml file:
     
    <ShapeFileMap shapeKey="USAMapCoords55" shapeType="Polygon" role="State" name="States of USA 55" descWeb="" descFlash="" descDesktop="" shapeFile="VisFramework/map/USAMapCoords55.html"/>
     
    The line above should be directly above the </ShapeFileMaps> line.


  • Restart MAD 9.4.1.6. (KB47805: "How to Properly Shutdown or Restart MicroStrategy Analytics Desktop 9.4.1.6")
  • Launch MAD 9.4.1.6.
  • Create a new dashboard using the My Dashboards > Samples > Datasets > Store Details dataset.
  • Click the icon for Select a Visualization.
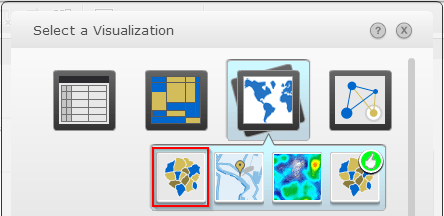
  • Choose the Map icon and select the Image Layout option. 

    Note: If this option is not available by default.  To enable this option, follow this article. 
     
ka0PW0000001JZRYA2_0EM44000000260Y.png
  • Add State to Geo Attribute and Row Count to Color By:


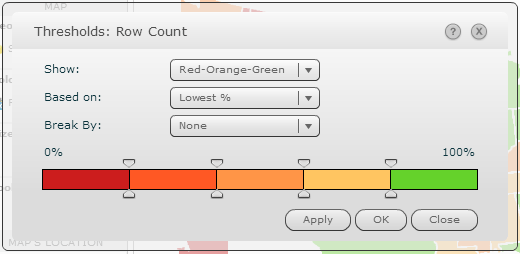
  • Make note that the thresholds is set as follows:
     
ka0PW0000001JZRYA2_0EM44000000260Q.png
  • Go to Show > Properties and select the Shapefile "States of USA 55"
  • Notice that the map does not apply the threshold defined for Color By:
     

Why is this happening?

This is a known issue with Strategy Analytics Desktop 9.4.1.6.
Our engineering team is working to enhance the overall Strategy experience.
 

Solution 

Strategy will continue to investigate and post updates as soon as they are available.
Please return to this KB article for updates and solutions.

Learning Resources

Interested in learning more about Dossier authoring? Visit the Learning Center on Community!
Or go to our Documentation pages for more product information.
 
 
CUSTOMIZATION WARNING:
This customization is provided as a convenience to Strategy users and is only directly applicable to the version stated. While this code may apply to other releases directly, Strategy Technical Support makes no guarantees that the code provided will apply to any future or previous builds. In the event of a code change in future builds, Strategy Technical Support makes no guarantee that an updated version of this particular customization will be provided. In the event of a code change in future builds, Strategy may not be able to provide additional code on this matter even though this customization is provided at this time for this specific build. For enhancements to this customization or to incorporate similar functionality into other versions, contact your Account Executive to inquire about Strategy Consulting assistance.


Comment

0 comments

Details

Knowledge Article

Published:

April 6, 2017

Last Updated:

March 21, 2024