When a report request that includes a metric, custom group, and report level filter is resolved by Strategy, the metric values are calculated first, then the custom group is resolved, and lastly the report filter is applied. If users want the filter to be applied before the custom group is resolved, they must apply the filter at the metric or custom group level, and not at the report level. An example is included below.
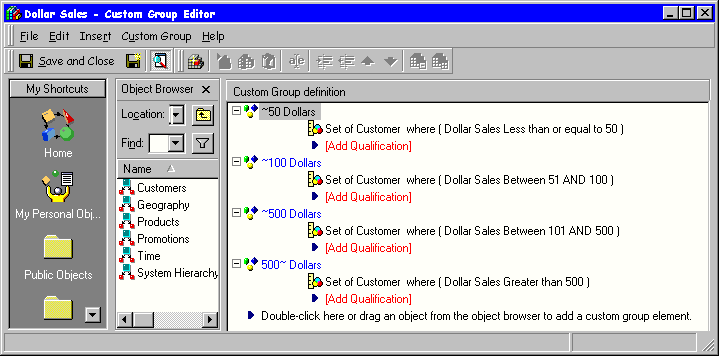
For example: A user defines a custom group similar to the example 'Dollar Sales' as shown below:
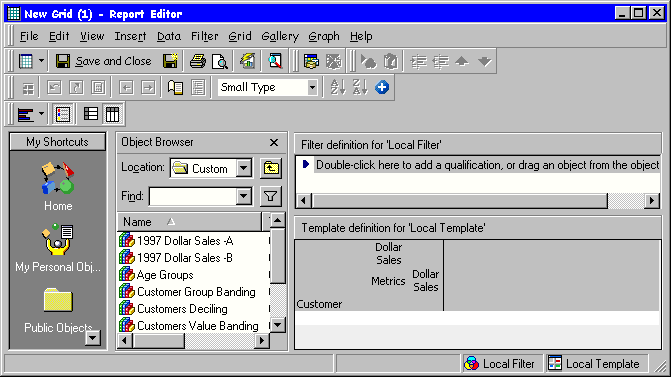
The user also defines a report, using custom group 'Dollar Sales'.
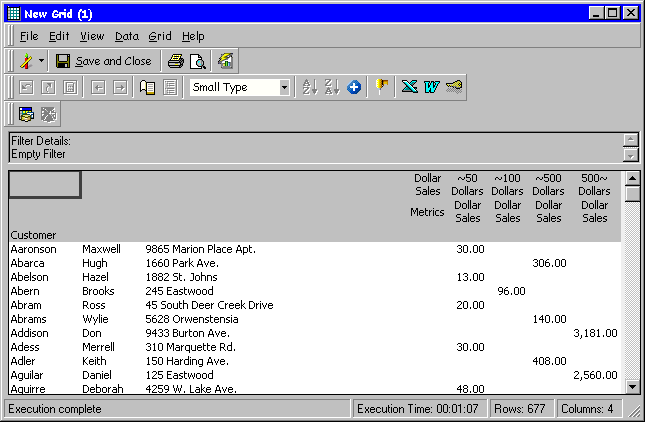
The report yields the following results. As expected, the values in each of the columns of the 'Dollar Sales' custom group fall within the defined range:
If the user applies a filter, such as Year=1997, at the report level, report will yield the following results:
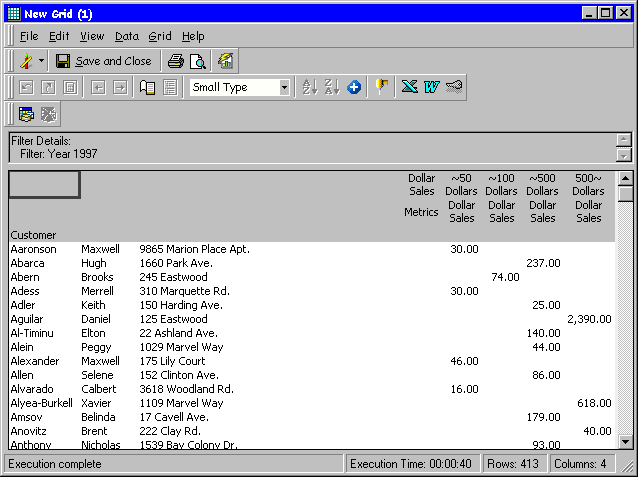
It seems as though the report is displaying the metric values in the wrong custom group columns (For example: The value 25.00 appears in the '~500 Dollars' column of the custom group). But the report is working as designed. When the custom group is applied, it checks only the qualification that was set in the custom group editor and not the qualification that was set at the report level.
In the above report, the Total Dollar Sales values are categorized according to the customer group definition first and then the Year=1997 filter is applied. This categorizes the customer by the total dollars that the customer spent and shows the amount the customer bought in the year 1997.
To categorize the customer based on the total dollars spent in 1997, add the filter at the custom group level or at the metric level.
For example:
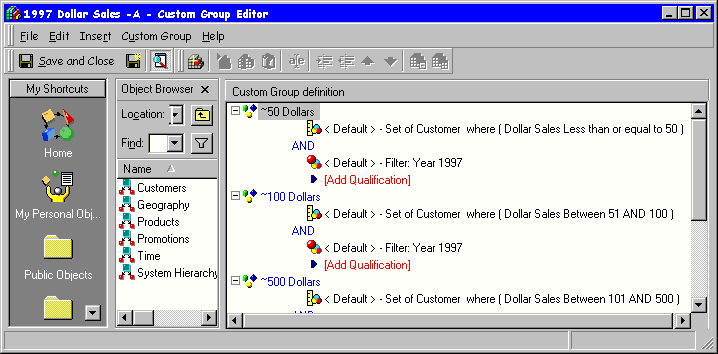
OR
Create a new Metric called '1997 Dollar Sales' using 'Dollar Sales' with Year = 1997 as an embedded filter in the metric, and use the new metric when creating the custom group.
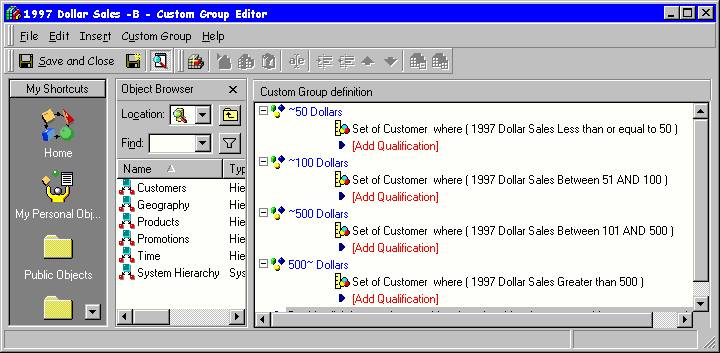
The report yields the desired results:
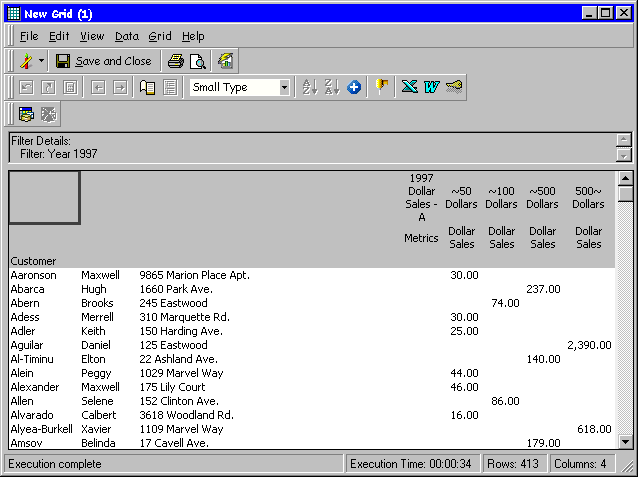
This feature adds more flexibility to the report. Users may want to display the Total Dollar Sales and want to Custom Group by Dollar Sales from Year 1997 or users may want to display the 1997 Dollar Sales and want to Custom group by Total Dollar Sales.
KB4789
