EducationSoftwareStrategy.com
StrategyCommunity

Knowledge Base

Product

Community

Knowledge Base

TopicsBrowse ArticlesDeveloper Zone

Product

Download SoftwareProduct DocumentationSecurity Hub

Education

Tutorial VideosSolution GalleryEducation courses

Community

GuidelinesGrandmastersEvents
x_social-icon_white.svglinkedin_social-icon_white.svg
Strategy logoCommunity

© Strategy Inc. All Rights Reserved.

LegalTerms of UsePrivacy Policy
  1. Home
  2. Topics

KB47941: How to configure an Image Layout widget to display a single layout with multiple attributes as tooltip information in MicroStrategy Web 9.4.1


Community Admin

• Strategy


How to configure an Image Layout widget to display a single layout with multiple attributes as tooltip information in MicroStrategy Web 9.4.1

In Strategy Web 9.4.1, developers can use the Image Layout widget to display information relative to a map or image. In Strategy Web 9.4.0 this widget was enhanced to support clusters of Image Layouts in a single widget. Refer to KB45716 New in MicroStrategy 9.4.0: Image Layout Widget displays multiple image maps. for more information on this enhancement. 
 
Due to this new functionality, displaying a single layout in a widget now requires a specific attribute configuration. The simplest case is to just include one attribute with the position information. Sometimes, Strategy Web developers might want to display attribute information as part of the tooltip. To accomplish this behavior, follow the steps below:
 
SCENARIO:
A single Image Layout wants to be displayed based on information. Additionally, the attribute information wants to be included in the tooltip as shown below:
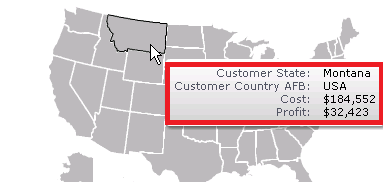
ka04W000000OdYRQA0_0EM44000000260K.png


There are two approaches to accomplish the same result:

  • Convert the attributes to be displayed in the tooltip to metrics.
  • Add a Shape File attribute with information for a single layout.
     

APPROACH 1: CONVERT ATTRIBUTES TO METRICS
If only one attribute is present in the grid it will be used as a geo-attribute for the position information. Additional attributes can be converted to metrics in order to be added to the grid and displayed in the tooltip. To convert the desired attributes follow these steps:
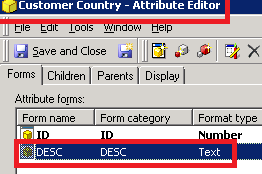
  • Identify the attribute and attribute forms to be displayed in the tooltip. In this example, the attribute is and the attribute form is DESC as shown below:
     
ka04W000000OdYRQA0_0EM44000000260J.png
  • In Strategy Web 9.4.1, edit the desired document.
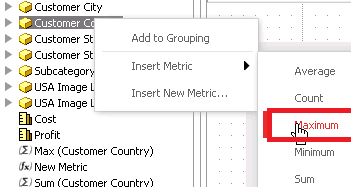
  • In the Dataset Objects, right-click the attribute to be displayed as a tooltip and select Insert New Metric>Maximum as shown below:
     
ka04W000000OdYRQA0_0EM44000000260F.png
  • Add the metric to the grid that will be used as the Image Layout.
  • Execute the document in Editable Mode.
  • Right click the metric header and select Rename/Edit.
  • Modify the metric definition to remove the lookup specification and explicitly specify the attribute form. In the example above the definition will look as shown below:


    Max(@DESC){~+}


  • Configure the grid as an image layout and ensure that no other attributes are present in the grid. Note that the Image Layout widget will now show a single Image with the attribute information in the tooltips  
     

APPROACH 2: ADD SHAPE FILE ATTRIBUTE
Adding an attribute with an attribute form with the location of the shape files allows users to display different Image Layouts in a cluster. However, if this attribute only contains information for one Shape File, a single Image Layout will be displayed.

  • In Strategy Developer 9.4.1 create a new attribute based on any table in the warehouse
  • For the attribute definition, select any column as the ID attribute form
  • For the Shape File attribute form hard code the path to the shape file used. If only Out of the Box shape files are used, this will be typically located under the following folder:


    /VisFramework/map 


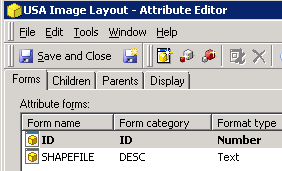
    In this example, the shape file needed is the USAMapCoords.html, and will be hardcoded as a string with the definition below:


    Concat("VisFramework/map/USAMapCoords.html", "") 


    Note: The name of the attribute form needs to be exactly


    SHAPEFILE


    The attribute will look similar to the screenshot below:
     
ka04W000000OdYRQA0_0EM440000002600.png
  • Update the schema
  • Add the attribute to the desired dataset
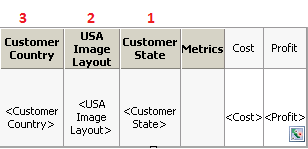
  • Edit the desired document and add the attribute in the second position from right to left after the attribute with the geolocation information. Any attribute in the next positions will be displayed in the tooltip. The grid structure will be similar to the one below:
     
ka04W000000OdYRQA0_0EM44000000260L.png

Comment

0 comments

Details

Knowledge Article

Published:

April 12, 2017

Last Updated:

April 12, 2017