EducationSoftwareStrategy.com
StrategyCommunity

Knowledge Base

Product

Community

Knowledge Base

TopicsBrowse ArticlesDeveloper Zone

Product

Download SoftwareProduct DocumentationSecurity Hub

Education

Tutorial VideosSolution GalleryEducation courses

Community

GuidelinesGrandmastersEvents
x_social-icon_white.svglinkedin_social-icon_white.svg
Strategy logoCommunity

© Strategy Inc. All Rights Reserved.

LegalTerms of UsePrivacy Policy
  1. Home
  2. Topics

KB47979: How to use a custom image as a map marker on an ESRI map in MicroStrategy Web 9.4.1 and 9.5.1


Community Admin

• Strategy


This article details the steps necessary to change the default map marker to a custom image in MicroStrategy web 9.4.1 and 9.5.1

In Strategy Web 9.4.1 the ESRI map widget will display markers as a diamond, like shown below.
 

ka04W000000OaadQAC_0EM44000000261V.jpeg


It is possible to use a custom image instead of the default marker.
 
ACTION:
  
Follow the instructions below to use a custom image as a map marker on an ESRI map widget in a report or Report Services document:
 
Note: The following steps are only applicable when the ESRI map widget is configured to display Image Markers, like shown below.

ka04W000000OaadQAC_0EM44000000261Z.jpeg


  • Run the report or the document in Editable mode.
  • Right-click the metric header > select Thresholds > Advanced Thresholds, like shown below.
     
ka04W000000OaadQAC_0EM44000000261a.jpeg
  • Add a condition on the metric with the desired values. Or, to display the image for all values, select "Is Not Null", like shown below.
ka04W000000OaadQAC_0EM44000000261F.jpeg
  • Open the Format options by selecting the "Cell formatting" icon, like shown below.
ka04W000000OaadQAC_0EM44000000261b.jpeg
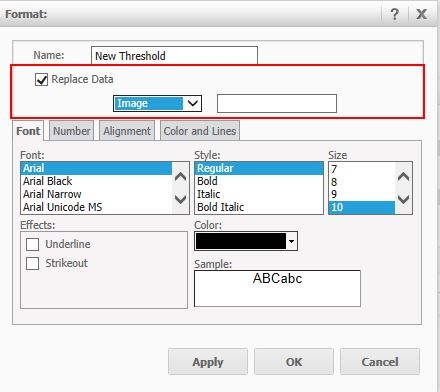
  • In the Format options, check "Replace Data" and select 'Image' in the drop-down, like shown below.
ka04W000000OaadQAC_0EM440000002614.jpeg
  • Place the image reference in the box, for example:

    Sample Code/Error
    http://img.informer.com/icons/png/48/3144/3144445.png

     
  • Notice the image displays for the metric values in the grid, like shown below.
ka04W000000OaadQAC_0EM44000000261D.jpeg
  • Run the report or document with the ESRI map configured; the markers will now display with the custom image.
ka04W000000OaadQAC_0EM44000000261A.jpeg

Note: Custom images only apply to Report Services reports and documents. Customizing map markers on an ESRI map visualization in Visual Insight is not supported.
KB47979


Comment

0 comments

Details

Knowledge Article

Published:

April 12, 2017

Last Updated:

November 23, 2018