EducationSoftwareStrategy.com
StrategyCommunity

Knowledge Base

Product

Community

Knowledge Base

TopicsBrowse ArticlesDeveloper Zone

Product

Download SoftwareProduct DocumentationSecurity Hub

Education

Tutorial VideosSolution GalleryEducation courses

Community

GuidelinesGrandmastersEvents
x_social-icon_white.svglinkedin_social-icon_white.svg
Strategy logoCommunity

© Strategy Inc. All Rights Reserved.

LegalTerms of UsePrivacy Policy
  1. Home
  2. Topics

KB48040: Grids overlap when opening a Visual Insight dashboard in MicroStrategy Office for Excel.


Community Admin

• Strategy


SYMPTOM:
 
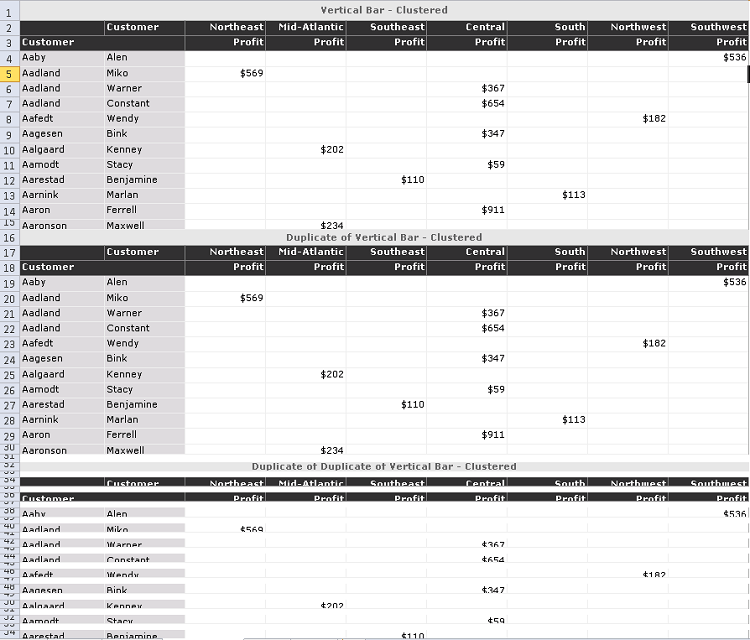
When loading a Visual Insight dashboard into Strategy Office for Excel, visualizations appear as grids that overlap one another, like shown below:
ka04W000000OghMQAS_0EM44000000260p.png

 
CAUSE:
 
This is a known issue in Strategy Office 9.4.1 for Excel.
 
ACTION:
 
Contact Strategy Technical Support for an update on this issue.
 
WORKAROUND:
 
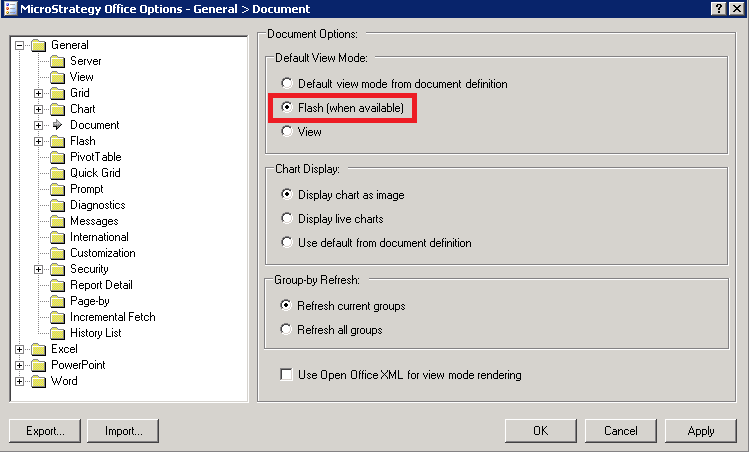
If the option "Flash (when available)" is selected, visualizations will be displayed as they are in Visual Insight, including scrollbars, like shown below:
ka04W000000OghMQAS_0EM44000000260r.png

Note that this will prevent editing any cells if using grid visualizations since the visualizations are being rendered with Flash.


Comment

0 comments

Details

Knowledge Article

Published:

June 12, 2017

Last Updated:

June 12, 2017