Starting with the release of Strategy ONE (March 2024), dossiers are also known as dashboards.
The objective of this document is to provide an estimation of resource requirements for stable and performant operation of the Telemetry Store (previously called Platform Analytics Consumer) architecture under a consistent transactional load. If you are not familiar with this architecture, see Platform Analytics Architecture.
The test attempts to simulate an average deployed environment processing ~100 Intelligence Server jobs per minute. Jobs consist of running reports, republishing cubes, executing subscriptions, etc.
In general, the CPU requirements to run Platform Analytics are small enough that they can effectively be ignored. Storage space requirements vary depending on usage patterns and environment topology, but we recommend allocating 85GB – 160GB of disk space on the machine where Kafka is deployed. MySQL storage space will grow over time based on Intelligence Server statistics logging settings, amount of transactions, and the amount of metadata objects. You can find an estimated formula based on transactions in the Test Results section for Storage.
Memory usage will vary depending on usage patterns, but at a minimum of 5-10 GB should be allocated to support the Telemetry Store architecture. The memory requirements for the Platform Analytics super cube (formerly known as data import cubes) vary depending on the amount of data included in the cube, however, it is recommended to allocate 20 GB based on the out-of-the-box governing limit on data import.
Two separate Strategy AWS environments with the same system resources were created: one with only basic statistics enabled, and one with advanced statistics enabled. For more details regarding basic versus advanced statistics, see Enable Telemetry Logging for Intelligence Server. A custom object management package with a variety of test objects (i.e. cubes, reports, dossiers, documents) was installed, and subscriptions were created on those objects set to a Strategy Event trigger. The event was then triggered every 60 seconds. Each trigger resulted in about 100 jobs/transactions on the Intelligence Server and sent multiple logs to Kafka. Data was gathered from a variety of tools on the environment, as well as CloudWatch, to offer an estimation of resource requirements for Platform Analytics telemetry.
For testing, a large metadata consisting of approximately 1.7 million objects of varied types, was used. Additionally, a test object package containing dossiers and reports built on top of a super cube were applied.
Data was generated by triggering subscriptions, causing executions and cube publications on the Intelligence Server. Logs regarding their execution were then sent to the Telemetry Server (Kafka). The Telemetry Store retrieved the logs from Kafka and ran an ETL on top of them, which then normalized and stored them in the Platform Analytics MySQL warehouse (platform_analytics_wh).
To start the test, the Load Metadata Object Telemetry trigger was executed to retrieve detailed lookup information on all objects. The subscriptions (from the performance test package) were then executed on the reports and dossiers built on the performance test cube to generate approximately 100 jobs/transactions every minute. The telemetry generated from these actions was processed by the Telemetry Store and loaded into the Platform Analytics warehouse. Finally, the data from the warehouse was loaded into a super cube to power several out-of-the-box dossiers.
Environment Condition | Version |
|---|---|
Operating System | RedHat Linux 7.x |
MicroStrategy 2019 Release | M2019 |
Amazon Web Services Instance | AWS - 32 vCPUs |
vCPUs | Intel Xeon E5-2686 v4 (Broadwell) |
Memory | Up to 244 GiB |
EBS Bandwidth | Up to 25 Gbps |
Note: This test was not performed in a clustered environment (neither Strategy nor Kafka were clustered) and the MySQL instance was deployed locally on the machine. Different environment topologies can have an impact on overall performance and resource requirements. Additionally, no front-end clients were used during this test.
The test was automated through scripts and APIs.
The test showed that the following resources are needed for the Telemetry Store architecture to achieve stability and performance:
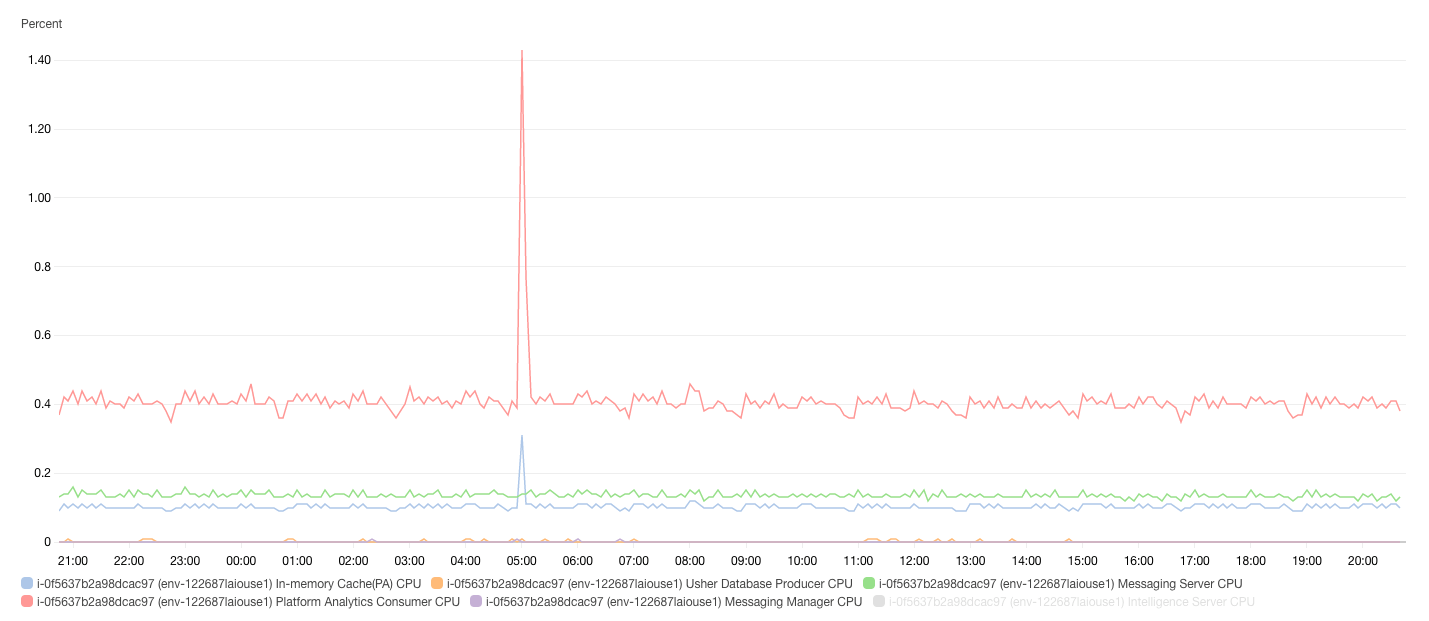
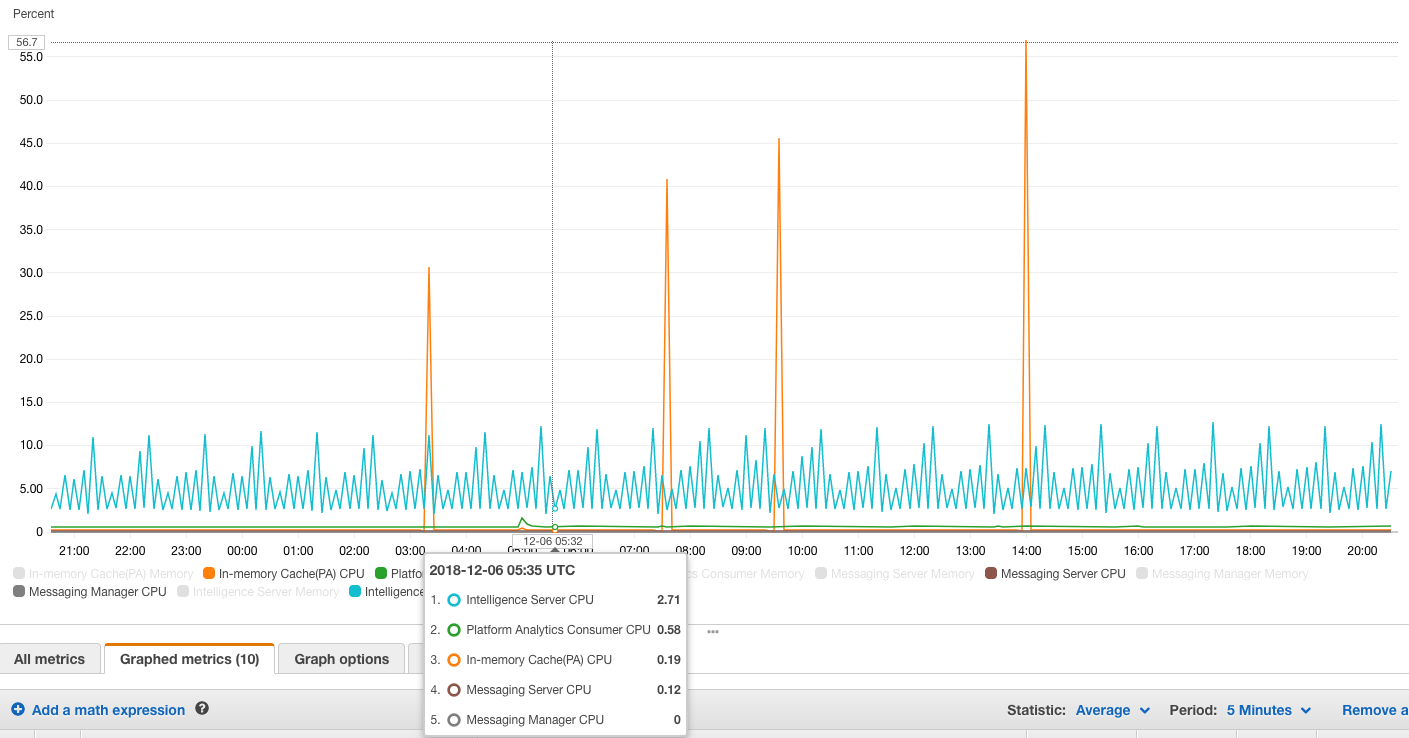
The Telemetry Store is light weight on CPU utilization. During peak load, CPU utilization was observed at ~1.5% of a 32vCPU machine. This translates to low utilization across any modern CPU architecture. All other components that make up the Platform Analytics architecture (Telemetry Server (Apache Kafka), Telemetry Manager (Apache Zookeeper), Telemetry Cache (Redis) also have a relatively low CPU utilization. The only exception may be MySQL server if it is deployed on the same machine and is under heavy load, then it may utilize more CPU resources.
The spike in CPU usage by the Telemetry Cache (Redis) is due to the RDB snapshotting process (which is enabled by default when Redis is deployed). When RDB snapshotting forces the process to persist the cache to disk, it encounters a large CPU load. This process can be disabled as the Telemetry Store does not rely on RDB snapshots for backups or persistence to disk. Redis can be repopulated after a shutdown event from the Platform Analytics warehouse by the Telemetry Store.
Note: CPU resources utilized by the Platform Analytics architecture (Telemetry Store, Telemetry Server, Telemetry Manager, Telemetry Cache) do not count towards CPU based licensing.
The Telemetry Store application itself is limited to 2 GB of memory, however, its components use a varied amount depending on configuration, tuning, and usage. The governing limit for the Platform Analytics cube is 20 GB out-of-the-box. Redis uses approximately 1.5-2 GB for a Metadata with > 1 million objects and a high transaction load. MySQL server is completely based on the value of the configuration parameter: @@innodb_buffer_pool_size. Telemetry Sever (Kafka) and Telemetry Manager (Zookeeper) use insignificant amounts of memory.
Application | Memory Usage |
Telemetry | < 2 GB |
MySQL | Configurable by MySQL Server variable: @@innodb_buffer_pool_size |
Platform Analytics Cube (super cube) | < 20 GB (Set by the governing limit) |
Redis | < 2 GB |
Suggested Memory | ~25 GB |
There are two main components that require significant storage: Telemetry Server (Kafka) storing the raw logs, and the MySQL server storing the normalized transaction data and lookup values. Peak utilization for storage occurs during the first week (depending on the Kafka log retention policy) due to the initial load of metadata objects. After this, data has time to expire, utilization decreases, and only metadata objects that have changed and statistics data are left.
Storage requirements also vary based on whether only basic statistics are enabled, or if basic and advanced statistics are enabled. A customer should allocate ~85 GB for Kafka logs, and .001 * (# of transactions / 1000) GB for transaction data in MySQL for basic statistics. If advanced statistics are enabled, allocate ~160 GB for Kafka logs and .005 * (# of transactions / 1000) GB for transaction data in MySQL. An additional ~3 GB is needed to store lookup information for metadata objects. The storage requirements will scale with time and transaction volume, and how much historical data is kept in the warehouse.
Below is the breakdown of storage requirements for each components of Telemetry Store:
Application | Storage Requirements |
Telemetry Server (Kafka) | Basic statistics - 85 GB Advanced statistics – 160 GB |
MySQL Server | Basic statistics - .001 * (# transactions / 1000) GB Advanced statistics - .005 * (# transactions / 1000) GB Lookup values for metadata objects - 3 GB |
Note: # transactions = total number of transactions (logins, executions, subscriptions etc.) expected to be stored in warehouse.