Starting with the release of Strategy ONE (March 2024), dossiers are also known as dashboards.
The following example uses Strategy Tutorial warehouse.
1. Open Strategy Web.
2. Create a new dataset DS1.
a. Click “New Data” -> “Databases” -> “Build a Query”.
b. Add table “LU_QUARTER” from the data source “Tutorial Data”.
c. To simplify the table, only select columns “YEAR_ID”, “QUARTER_ID”.
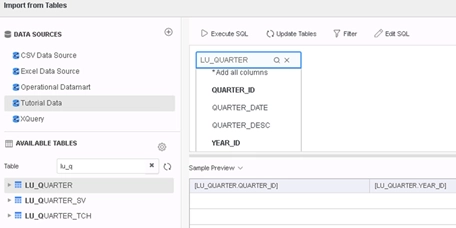
d. Click “Finish” and save the dataset as In-memory cube.
3. Create a new dataset DS2.
a. Click “New Data” -> “Databases” -> “Build a Query”.
b. Add tables “CITY_MNTH_SLS” and “LU_MONTH” from data source “Tutorial Data”.
c. To simplify the table, only select columns “Month_ID”, “TOT_COST” from CITY_MNTH_SLS and “MONTH_ID”, “QUARTER_ID”, “YEAR_ID” from LU_MONTH.
d. Right click on “QUARTER_ID” and choose basic filter. Make it in list of 20141, 20142, 20143, 20144.
e. Click “Finish” and save the dataset as In-memory cube.
4. Create a new dossier with DS1 and DS2.
5. Under DS1, create 3 new derived metrics:
a. Create “CountM” (defined on attribute) with expression:
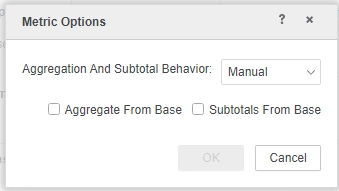
Count(Month Id){~+}Sum(Case(([Quarter Id]@ID>0), ([Tot Cost]/CountM), 1)){~+}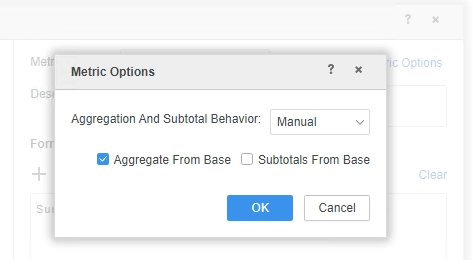
c. Create “CaseSmart” (defined on CaseAFB) with expression:
CaseAFB
6. Add attribute “Year Id” and derived metric “CaseSmart” into visualization,a unspecified error is shown. Due to this error, Query Detail is also empty.
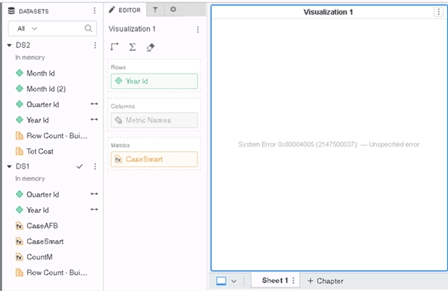
This is a known defect before Strategy 2020.
In Strategy 2019 and earlier builds, metrics defined on attributes and facts are treated the same as metrics defined on only attributes. Such logic is wrong and will affect both metrics themselves and other derived metrics defined on them.
To resolve this defect, please upgrade to Strategy 2020 or above, and set project level setting Data Engine Version setting to 2020. For more details on enabling the setting, see Change Data Engine Version .
In Strategy 2020 the logic is fixed and data could be displayed properly. CSI is also generated correctly in Query Detail.
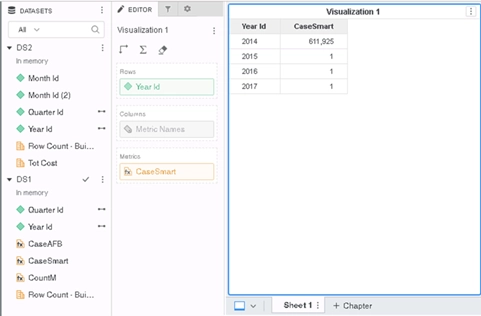
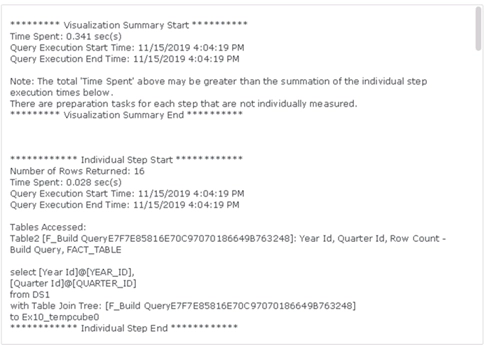
Regression Defect
This fix causes a regression data issue in Strategy 2020 with Data Engine Version 2020(Internal ID DE165538) when:
1. Dossier is using multiple datasets
2. Derived Metrics are defined on the combination of attribute and metric
MaxOfQuarter: Max(Prev Quarter Id){~+}
CaseAFB1= Sum(Case(([MaxOfQuarter]=20051), ([Tot Cost]), 1)){~+}
CaseAFB2= Sum(Case(([MaxOfQuarter]=20052), ([Tot Cost]), 1)){~+}
CaseAFB3= Sum(Case(([MaxOfQuarter]=20053), ([Tot Cost]), 1)){~+}
DM= (CaseAFB1 + CaseAFB2)/CaseAFB3
Add DM into visualization, it returns no data.
This regression data issue is fixed in Strategy 2021 with Data Engine Version 2020. After the fix, the data is correct and consistent with Data Engine Version 2019.
Strategy Internal Reference Number for this technical note is KB483765 and DE145994
