Starting with the release of Strategy ONE (March 2024), dossiers are also known as dashboards.
Description
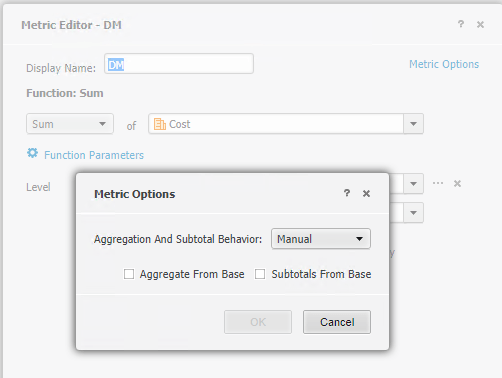
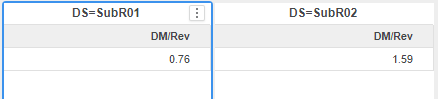
The Derived Metric returns different value when choosing different Data Sources if the Derived Metric based on Base Metrics which are from different datasets and the Base Metrics exist in multiple datasets. The fix is made with Data Engine Version 2021.
Steps to Reproduce
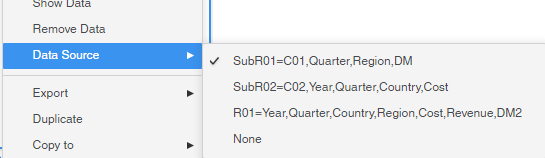
This procedure is using Strategy Tutorial WH that is shipped with Strategy products.
************ Individual Step Start ************
Number of Rows Returned: 1
Time Spent: 0.003 sec(s)
Query Execution Start Time: 3/18/2021 3:34:24 PM
Query Execution End Time: 3/18/2021 3:34:24 PM
select sum([Revenue]),
sum([Cost])
from SubR02=C02,Year,Quarter,Country,Cost
************ Individual Step End ************
************ Individual Step Start ************
Number of Rows Returned: 1
Time Spent: 0.000 sec(s)
Query Execution Start Time: 3/18/2021 3:34:24 PM
Query Execution End Time: 3/18/2021 3:34:24 PM
select sum([Cost])
from SubR01=C01,Quarter,Region,DM
to Ex7_tempcube0
************ Individual Step End ************
************ Individual Step Start ************
Number of Rows Returned: 1
Time Spent: 0.002 sec(s)
Query Execution Start Time: 3/18/2021 3:34:24 PM
Query Execution End Time: 3/18/2021 3:34:24 PM
select sum([Revenue])
from SubR02=C02,Year,Quarter,Country,Cost
to Ex7_tempcube1
************ Individual Step End ************
************ Individual Step Start ************
Number of Rows Returned: 1
Time Spent: 0.001 sec(s)
Query Execution Start Time: 3/18/2021 3:34:24 PM
Query Execution End Time: 3/18/2021 3:34:24 PM
select *
from Cross Join(
Ex7_tempcube0,
Ex7_tempcube1
)
************ Individual Step End ************
Cause
This is a known issue in Strategy.
Solution
This issue has been addressed in Strategy 2021.
To pick up the fix, upgrade to Strategy 2021 or above and enable project level setting "Data Engine Version" to 2021 or above. For more details on enabling the setting, refer to Change Data Engine Version.
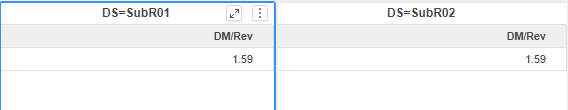
After the fix, the Visualizations return same data for different Data Sources.
Check the Query Details, it’s the same for Visualizations with different Data Sources.
************ Individual Step Start ************
Number of Rows Returned: 1
Time Spent: 0.002 sec(s)
Query Execution Start Time: 3/18/2021 4:11:09 PM
Query Execution End Time: 3/18/2021 4:11:09 PM
select sum([Cost])
from SubR01=C01,Quarter,Region,DM
to Ex0_tempcube0
************ Individual Step End ************
************ Individual Step Start ************
Number of Rows Returned: 1
Time Spent: 0.002 sec(s)
Query Execution Start Time: 3/18/2021 4:11:09 PM
Query Execution End Time: 3/18/2021 4:11:09 PM
select sum([Revenue])
from SubR02=C02,Year,Quarter,Country,Cost
to Ex0_tempcube1
************ Individual Step End ************
************ Individual Step Start ************
Number of Rows Returned: 1
Time Spent: 0.001 sec(s)
Query Execution Start Time: 3/18/2021 4:11:09 PM
Query Execution End Time: 3/18/2021 4:11:09 PM
select *
from Cross Join(
Ex0_tempcube0,
Ex0_tempcube1
)
************ Individual Step End ************
Strategy internal reference number for this technical note is DE165055.