Starting with the release of Strategy ONE (March 2024), dossiers are also known as dashboards.
In a dossier, the Gauge visualization is different from other visualizations in that it does not allow the user to select which attribute forms to display. It does not have the option of "Display Attribute Forms" when right-clicking on the attribute, as shown below:
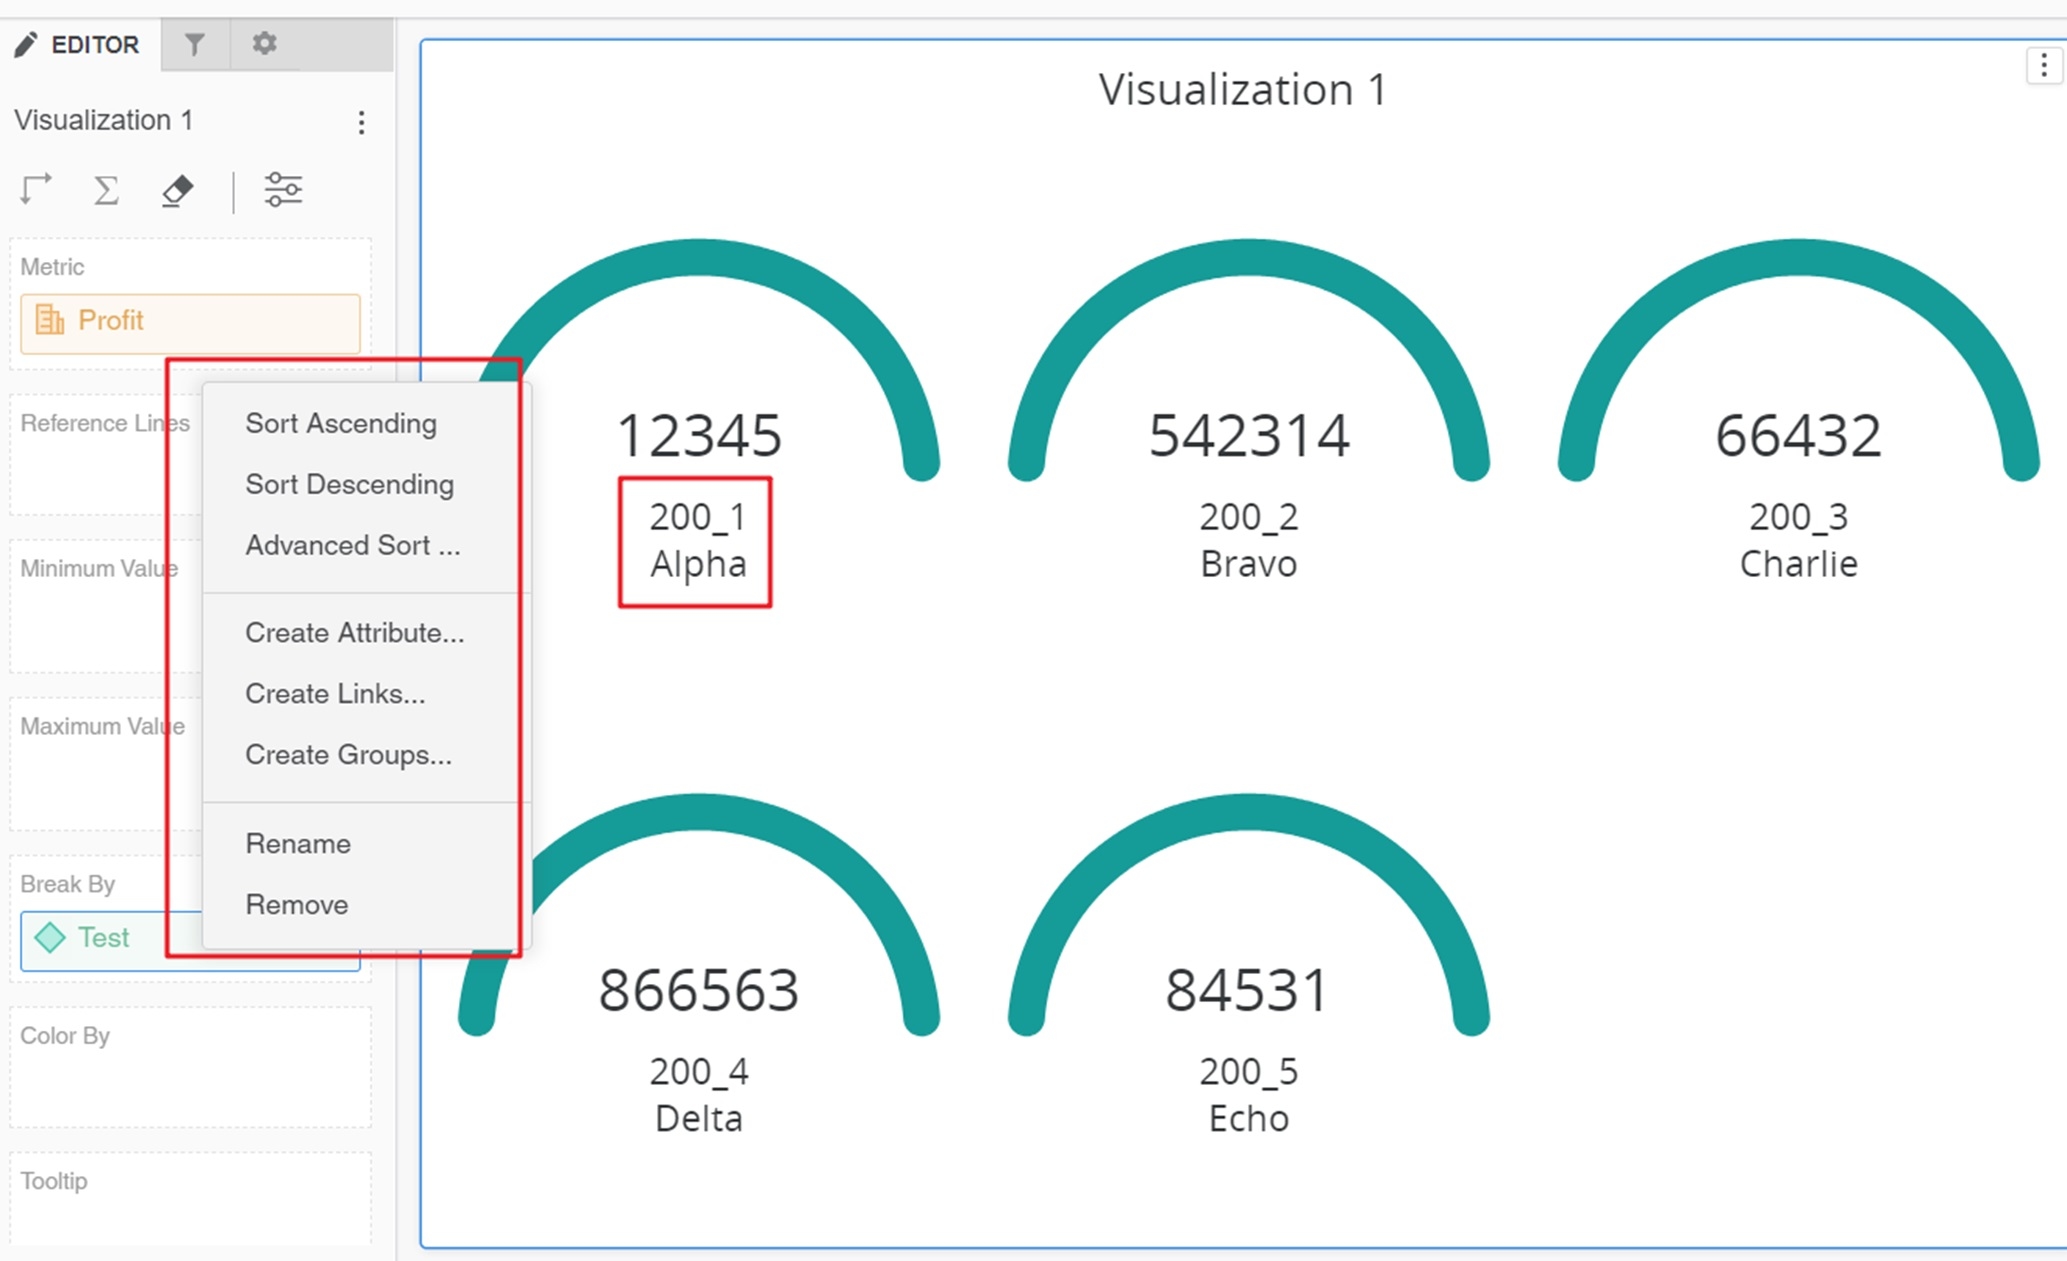
Other visualizations, e.g. Bar Chart, users can choose which attribute forms to display using the "Display Attribute Forms" when right-clicking on the attribute, like shown below:

Create a Grid visualization first, add the attribute and metric. Then right-click the attribute and choose the form. Then change this Grid visualization to the Gauge visualization.
