Users are confronting issues while viewing legend titles on a graph visualization on dashboards in Strategy Library and Strategy Web. The trouble arises specifically when the legend title label gets truncated because the legend box size adjusts solely to the 'Attribute element' name size and fails to auto-adjust to accommodate the entire Label name.
The problem of legend title truncation arises when 'Attribute element' names are short, and the legend title labels are longer. The legend box is sized to fit the 'Attribute element' names and does not automatically adjust to accommodate longer label names. This results in insufficient space for the full label, causing truncation. This issue occurs in Strategy 2021 Update 12 during the display of legends in a simple graph visualization.
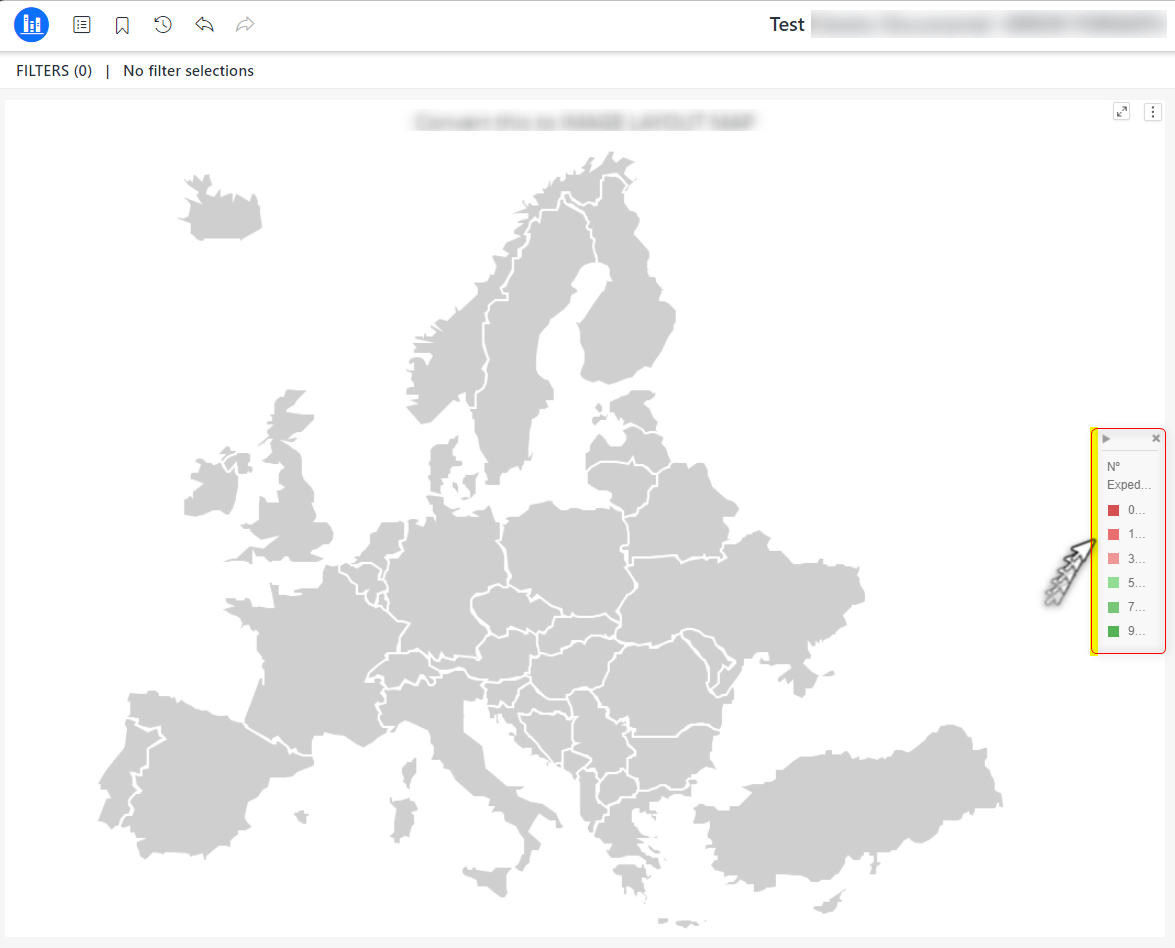
Address this issue by repositioning the legend in a Graph Visualization. This feature, introduced in Strategy ONE (March 2024), offers more flexible legend positioning for graphs - supporting bar, line, area, scatter, and pie charts. To implement this solution:
1. Open a dashboard.
2. Select your desired visualization type.
3. In the Format panel, enable the Legend option.
4. Drag the legend to one of the following positions:
- Top/bottom: left, center, right
- Right/left: top, center, bottom

Positioning Legends in Graph Visualization https://www2.Strategy.com/producthelp/Current/Library/en-us/Content/position_legend.htm
