1. Create a dashboard with a grid visualization with a few attributes and a metric. For example, within Tutorial Project, choose Region, Employee First Name , Employee Last Name and Cost.
2. Create an attribute selector targeting the grid and select one or all attributes to be displayed:
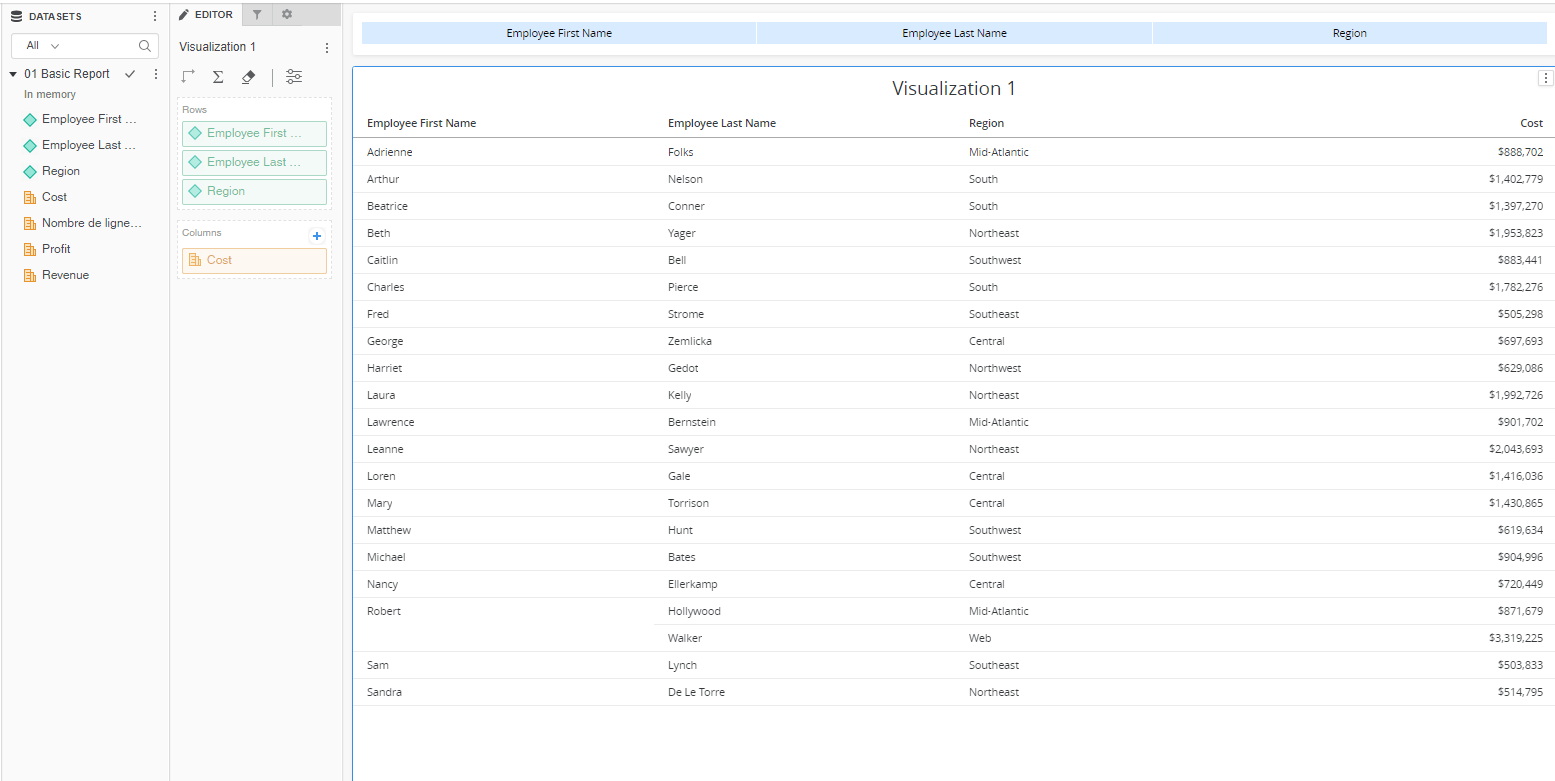
3. Observe that the columns and rows are freely movable:


4. Then add the Cost metric to the filter panel and set it to for example, Greater than or equal to 500000:
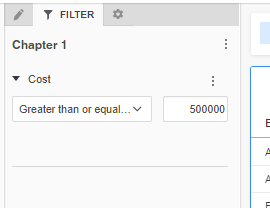
5. Observe now that the columns and rows are no longer freely movable.
6. Remove the filter condition, add/remove another attribute to the grid and observe that the rows and columns are once again freely movable.
