EducationSoftwareStrategy.com
StrategyCommunity

Knowledge Base

Product

Community

Knowledge Base

TopicsBrowse ArticlesDeveloper Zone

Product

Download SoftwareProduct DocumentationSecurity Hub

Education

Tutorial VideosSolution GalleryEducation courses

Community

GuidelinesGrandmastersEvents
x_social-icon_white.svglinkedin_social-icon_white.svg
Strategy logoCommunity

© Strategy Inc. All Rights Reserved.

LegalTerms of UsePrivacy Policy
  1. Home
  2. Topics

KB486857: How to hide or display columns in a dashboard via a checkbox in MicroStrategy Web/Library


Kevin Mohammed

Senior Product Specialist • MicroStrategy


This article gives a brief example of how to utilize an attribute selector to hide or display columns in a grid.

Strategy developers may wish to control whether certain columns in a grid are visible via use of a checkbox. The easiest way to utilize this functionality is with an attribute selector. Please see the example below.
 

  1. Open the dashboard that needs to be modified or create a new blank dashboard.
  2. Select the chapter that contains the visualization to filter. In the example, there is a visualization with a grid containing Category attribute, Subcategory attribute, and Cost metric.
ka0PW0000003161YAA_0EMPW000007sUxy.png
  1. In the top toolbar, click Filter and choose Attribute/Metric Selector. An empty selector appears in the dashboard.
  2. Drag the attributes and metrics to use as selectors from the Datasets panel to the empty selector. Use the Ctrl key to select multiple attributes and metrics. In the example, the Category and Subcategory attributes are utilized.
ka0PW0000003161YAA_0EMPW000007sUxz.png
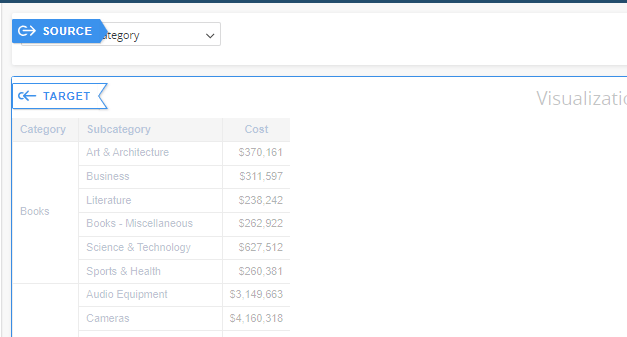
  1. Click Edit Targets.
  2. Click on target visualizations or visualization filters to select them. Targets must be on the same page. In our example, this is the visualization containing the grid.
ka0PW0000003161YAA_0EMPW000007sUy0.png


  1. While selecting visualizations, choose the attribute or metric to replace from the pop-up.
  2. After selecting the visualizations, click Apply.
  3. In the Format Panel, choose Allow multiple selections to allow users to select multiple objects. This option is only available if the target of the selector is a grid.
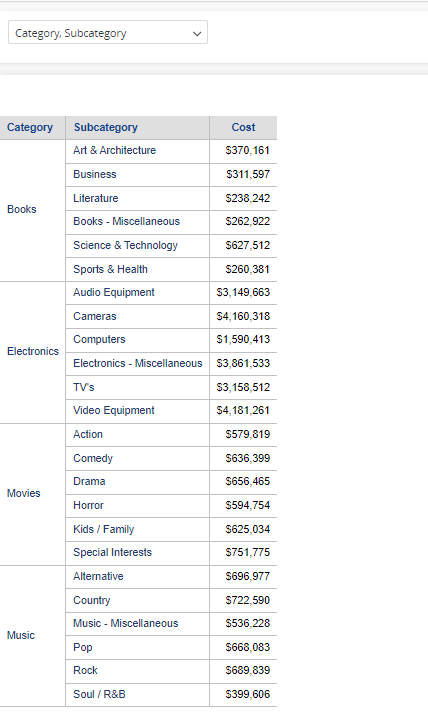
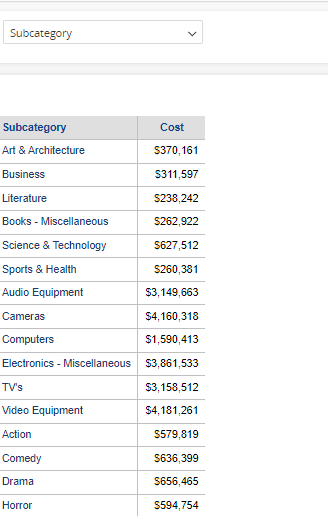
  4. Now, when selecting or deselecting the attributes in the attribute selector, the corresponding columns in the visualization will be displayed or hidden respectively.

Example with Category and Subcategory attributes selected:
ka0PW0000003161YAA_0EMPW000007sQ4k.png

Example with Category selected and Subcategory not selected:
ka0PW0000003161YAA_0EMPW000007sQ4l.png


Comment

0 comments

Details

Knowledge Article

Published:

August 14, 2024

Last Updated:

August 14, 2024