When exporting data to a Pivot Table in the Strategy for Office Excel Add-In or with the Strategy for Power BI Connector, compound metrics such as percentages or contributions (Smart Metrics) are also exported, but the metric values of aggregated levels when the most granular level is not present in the grid are incorrect. The user needs to export the data at the most granular level and redo the formulas in Excel and Power BI, although these metrics are already calculated in Strategy.
Strategy for Office Excel Add-In (based on the "Strategy Tutorial" project)
1. Log in to Library.
2. Create a blank dashboard.
3. Click on "Add Existing Objects".
4. Add the "Category", "Subcategory" and "Item" attributes and the "Profit Margin", "Profit" and "Cost" metrics. These attributes belong to the Product hierarchy, where "Item" is the most granular level. "Profit Margin" is a compound metric with the definition set to (Profit / Revenue).
5. Add all objects to a grid visualization.
6. Save the dashboard.
7. Open Excel and connect to the Strategy for Office Excel Add-In.
8. Click on the "Add Data" button.
9. Select the dashboard created previously.
10. Click on "Import".
11. Select the grid visualization via the small circle icon on the top left of the visualization.
12. Click on the arrow next to the "Import Data" button, then select "Import Pivot Table".
13. Click again on "Import Pivot Table".
14. Click on the visualization area (where "Click in this area to work with the PivotTable report" appears).
15. Select all object checkboxes so that they are added into Excel.
16. Compare the values in Excel and in Library. It is observed that all values are correct.
17. Remove "Item" (the most granular level) from the grid in both Excel and Library. It is observed that "Profit Margin" (compound metric) values are different, while "Profit" and "Cost" (not compound metrics) values are correct.
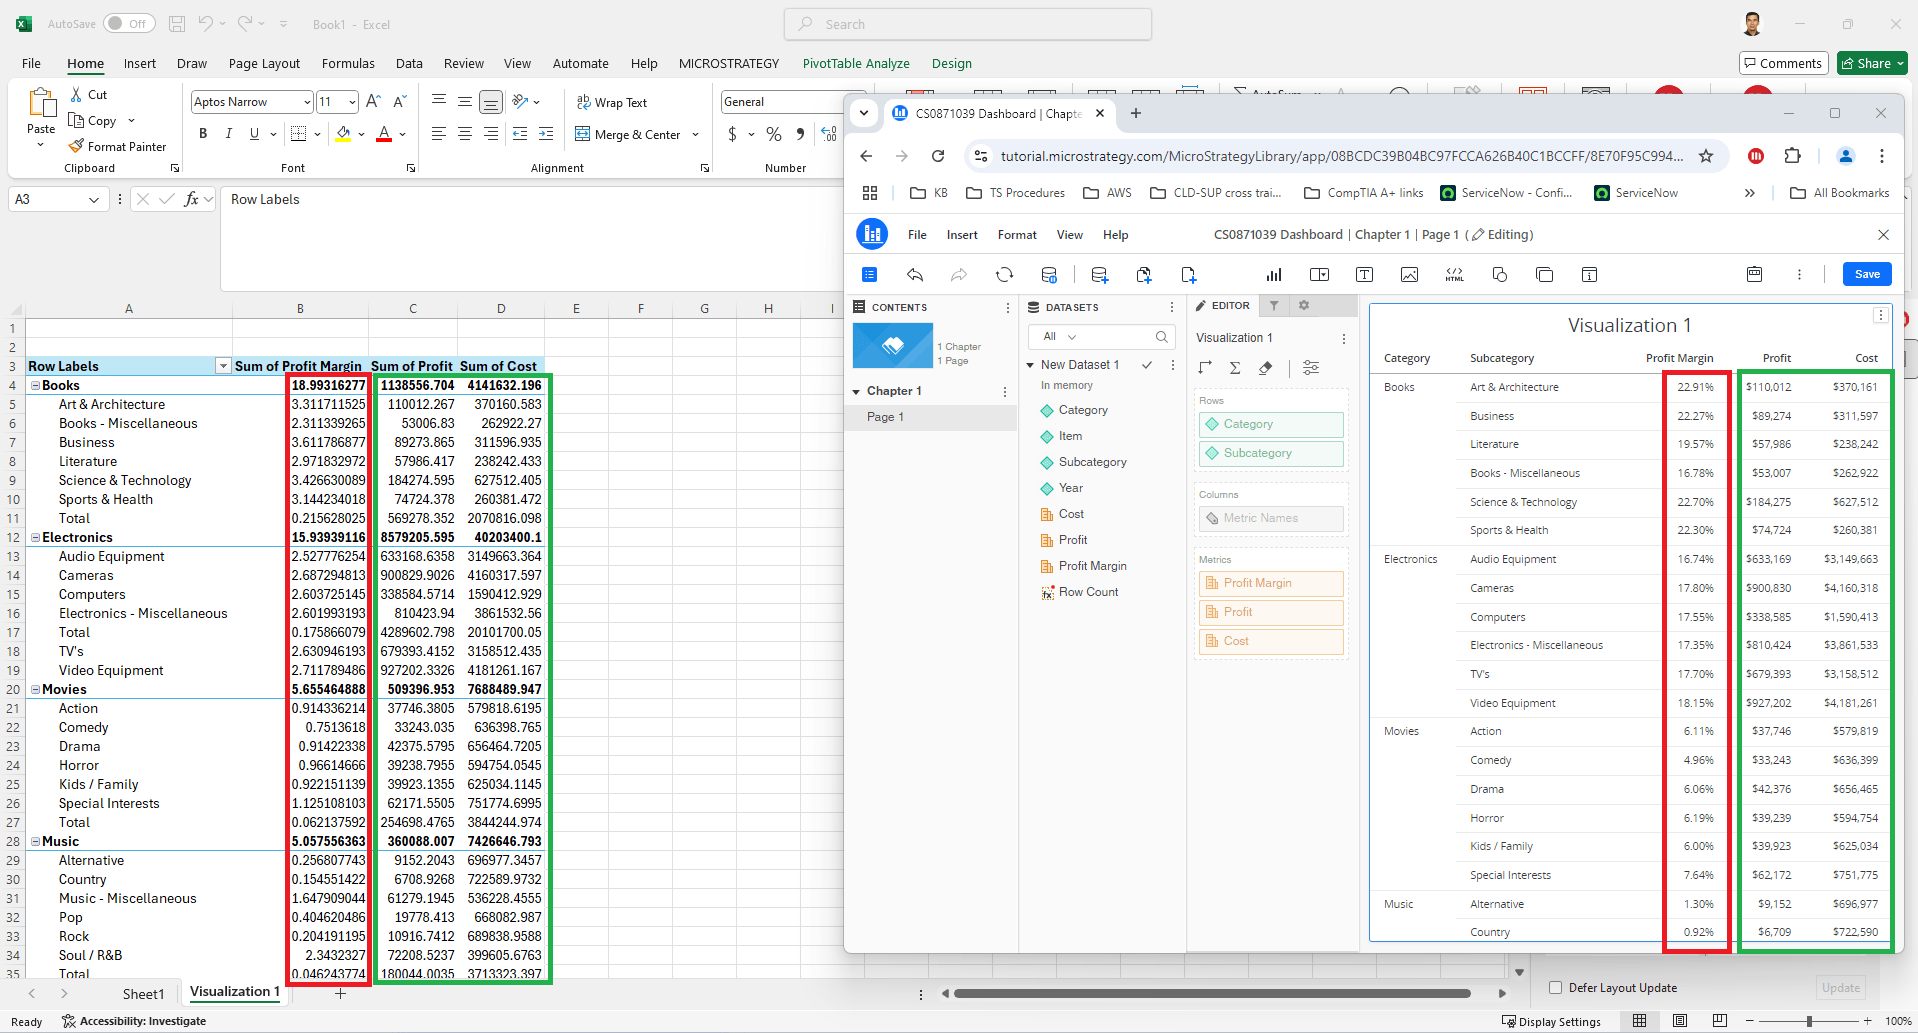
If in step 12 "Import Data" is selected, the issue does not appear. It only happens for "Import Pivot Table".
Power BI
1. In Library, create a report with the following objects and add all of them to the grid:
- Attributes: "Category", "Subcategory" and "Item".
- Metrics: "Profit Margin", "Profit" and "Cost".
2. In Power BI, connect to the environment Library URL and import the created report.
3. On the right hand side, click on all checkboxes to add them to the Power BI dashboard.
4. Observe that the value of "Sum of Profit Margin" for "100 Places to Go While Still Young at Heart" is "0.26", while the value of the same in Library is 26.14%, which is the same, but in percentage. This is correct.
5. Click on the "Item DESC" checkbox to remove "Item" from the Power BI dashboard.
6. Observe that the value of "Sum of Profit Margin" for "Art & Architecture" is "3.31", while the value of the same in Library is 21.56%, which is totally different, so it is wrong.
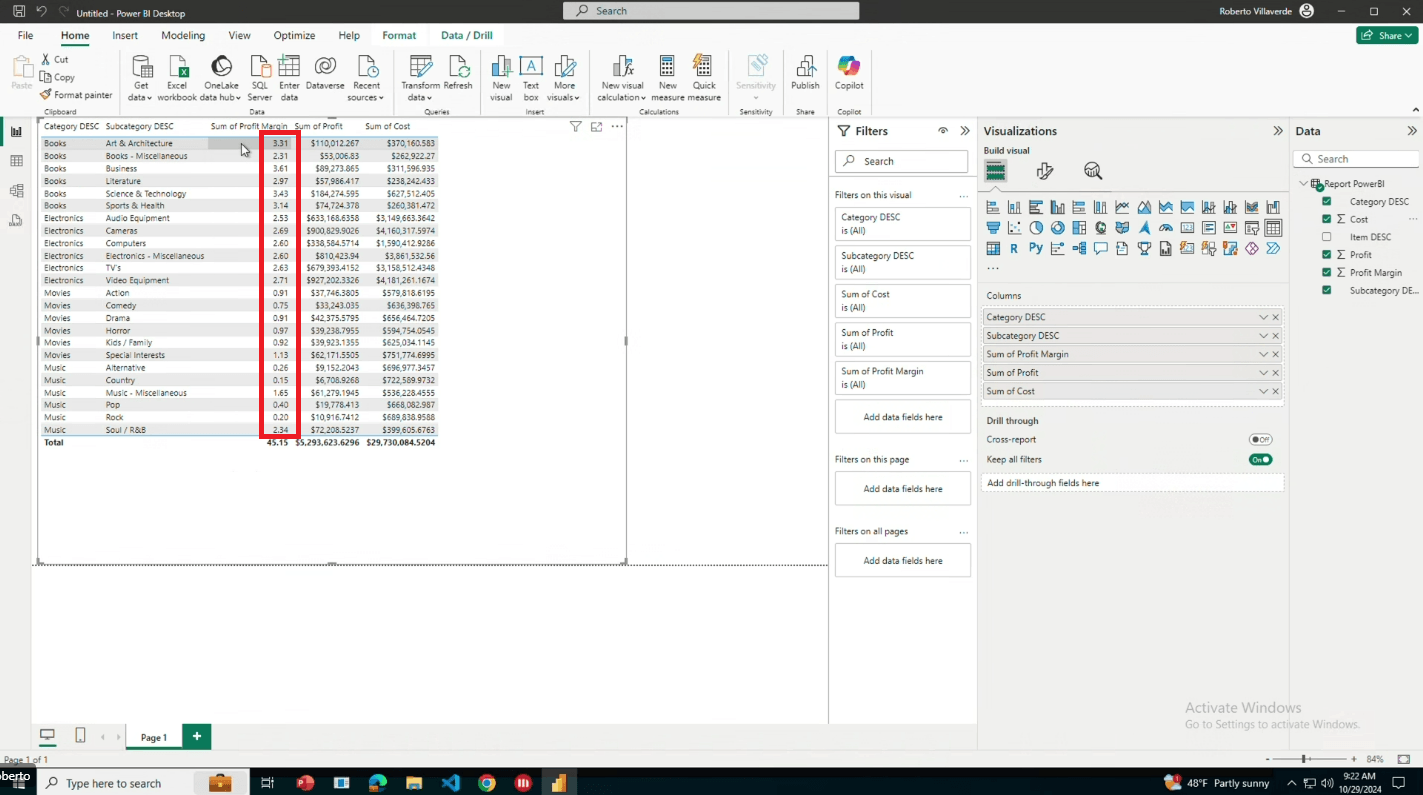
This behavior is caused by a limitation on Excel API and Power BI API sides.
The described issue is the expected behavior of the Excel's Pivot Table. Totals in Pivot Tables are calculated by an aggregation function which can be changed by the user. Unfortunately, there is currently no option in the Excel's API to set custom aggregation function (see https://learn.microsoft.com/en-us/office/dev/add-ins/excel/excel-add-ins-pivottables#change-aggregation-function). Totals of Smart Metrics from Library can still be imported into Excel. Also, there is a Pivot Table section in the Add-in's settings that can automatically populate the Pivot Table with attributes and values, improving initial data formatting.
The issue in Power BI comes from how it handles summarization for non-additive metrics, such as percentages. When compound metrics are imported, Power BI applies default aggregation, which results in incorrect calculations at higher levels of grouping. After data import, it might be helpful to change the default Summarization by clicking on the metric, then at the ribbon in Column tools change Summarization to Don't Summarize. Unfortunately, the Power BI REST API does not currently allow for direct configuration of column summarization during import, and fixing this is on Power BI side, hence out of Strategy scope.
This is a known issue and currently under investigation. Please contact Strategy Cloud Support for more details.
